
Published Jul 16, 2026
GA4 Conversion Attribution Models Report: Interaction Time vs Conversion Time
GA4 can now place attributed conversion credit on the date of the marketing interaction or on the date the conversion occurred. This guide explains how the two timelines change channel results, period comparisons, CPA and ROAS interpretation, and reconciliation with Google Ads or CRM data.
Category: Analytics & Conversion Tracking · By Mikalai Sasau
Google Analytics 4 can now report attributed conversion credit against two different clocks: the date of the marketing interaction or the date when the conversion actually occurred. This guide explains why that choice can change channel totals inside the same date range, how it interacts with Data-driven and Last click attribution, and which view to use for campaign analysis, revenue reporting, Google Ads comparisons, and CRM reconciliation.
Practical default: use Interaction time when the question is whether a campaign, click, or media cohort produced enough conversions for its cost. Use Conversion time when the question is how many sales or leads actually happened during a business period. Keep both views available, label them clearly, and never splice them into one unlabeled time series.
Executive summary
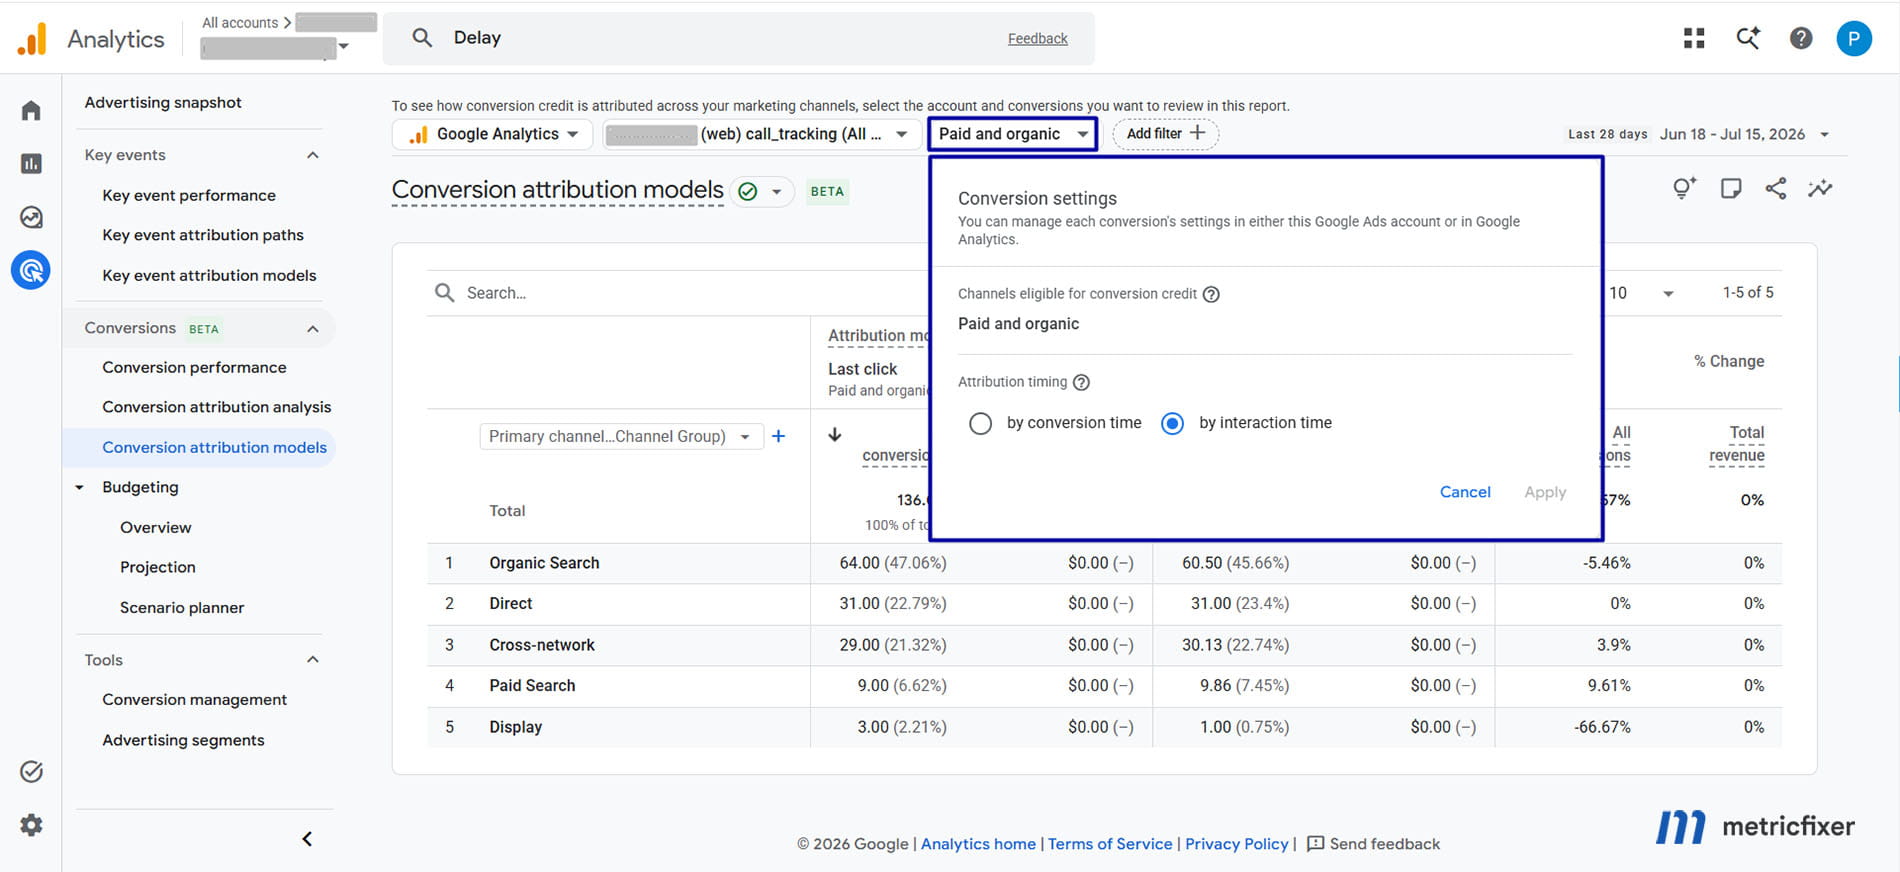
Google added the new conversion-focused reporting experience as part of its broader cross-channel conversion reporting rollout. The relevant reports let eligible Google Analytics properties select conversions shared with Google Ads, compare attribution models, and report results by either Conversion time or Interaction time. The feature is still being rolled out gradually, so it may not yet be visible in every property.
The most important point is that attribution model and attribution timing answer different questions. The model decides which touchpoint receives credit. For example, Data-driven attribution can divide one conversion across several interactions, while Last click gives the full credit to one final eligible interaction. Attribution timing then decides which calendar date receives that already-calculated credit.
With Interaction time, credit is placed on the dates of the interactions that contributed to the conversion. A conversion completed next week can therefore be added later to this week's interaction-based report. With Conversion time, the same credit is placed on the date the conversion occurred, even when the contributing clicks happened before the selected period.
This distinction is operationally valuable because Google Ads normally associates its main conversion columns with the ad interaction date, while CRM, ecommerce, and finance systems usually organize outcomes by the actual lead, order, or sale date. GA4 can now expose both views within the same conversion reporting workflow instead of forcing analysts to treat one reporting clock as universally correct.
What Google launched—and what is genuinely new
Google's 2026 cross-channel conversion reporting changes brought conversion management and conversion reporting closer together inside GA4. The new reporting layer is designed around Google Ads conversions created from Google Analytics key events. In practical terms, the measurement flow is:
Measurement workflow: collect an event in GA4 → mark the event as a key event → create a Google Ads conversion from that key event → analyze the shared conversion in GA4's conversion reports using Analytics or Google Ads settings.
This terminology matters. A key event is an important event used in Google Analytics reporting. A conversion, in this newer GA4 interface, is an action created from an event or key event and shared with Google Ads for advertising reporting and, where configured, bidding. The new conversion reports therefore do not automatically contain every key event in the property.
The conversion reporting experience includes a Conversion performance report and a Conversion attribution models view. Google documents the ability to select conversions, compare models, switch dimensions, and choose reporting by conversion or interaction time. The Conversion performance report also includes cost, revenue, CPA, and ROAS metrics calculated for the selected reporting clock.
There is a naming trap. Google also introduced a separate Conversion attribution analysis report focused on assisted conversions and the early, middle, and late roles of touchpoints. That is not the same report as the model-comparison view discussed here.
Strictly speaking, the time switch is not completely new to GA4. The older Key event attribution models report already documents equivalent Event time and Ad interaction time options. The meaningful improvement is that the choice is now part of a conversion-centric workflow aligned with Google Ads conversion actions, conversion settings, cost metrics, and the All conversions reporting family.
Do not confuse attribution timing with four other settings
Most attribution mistakes begin when several independent controls are treated as one setting. Before interpreting a report, separate the following questions:
| Control | Question it answers | Example | What it can change |
|---|---|---|---|
| Attribution model | Which touchpoint receives credit, and how much? | Data-driven versus Last click |
The split of conversions and revenue between channels, campaigns, and touchpoints. |
| Attribution timing | On which date is the attributed credit reported? | Interaction time versus Conversion time |
The period in which credit appears. It can materially change totals inside a limited date range. |
| Lookback or conversion window | How far back can an interaction remain eligible? | 30, 60, or 90 days for many GA4 key-event use cases | Whether an older interaction can receive any credit at all. |
| Channels eligible for credit | Can only Google paid channels receive credit, or can paid and organic channels receive it? | Google paid channels versus Paid and organic channels |
The channel scope and the total visible in Analytics compared with Google Ads. |
| Counting method | How many occurrences of the action are counted? | Count once versus count every qualifying action, depending on conversion configuration | The conversion count itself, independently of timing and model. |
Changing the reporting clock does not turn Data-driven attribution into Last click, extend the lookback window, change the counting method, or add organic channels to a Google-paid-only conversion. It only changes where the attributed credit is placed on the calendar.
How Interaction time works
With Interaction time, GA4 anchors attributed conversion credit to the date of the marketing interaction that earned it. Google describes this as reporting based on the ad interactions that later led to a conversion.
Under Last click attribution, the behavior is easy to picture: the full conversion is assigned to the date of the final eligible interaction. Under Data-driven attribution, the behavior is more granular. If one conversion is divided across three touchpoints, each fractional share is placed on the date of its own interaction.
This makes the view useful for media-cohort analysis. The spend, clicks, impressions, and attributed outcomes are more closely aligned with the period in which the marketing activity occurred. It is therefore usually the stronger view for questions such as:
- Did the campaigns that ran in June generate enough eventual revenue to justify their June spend?
- Which click, keyword, campaign, or channel cohort produced the strongest CPA or ROAS?
- How does GA4 compare with the standard interaction-dated conversion columns in Google Ads?
- What residual conversions continued to arrive from a campaign after it stopped running?
The trade-off is that recent interaction-based data is not mature. A click from yesterday may convert tomorrow, next week, or later within the applicable conversion window. The conversion will then be backfilled to the earlier interaction date. Data-driven attribution can also reassign credit for several days after the conversion as the model finishes processing the path.
Interaction-time reports should therefore be read as a cohort report whose newest dates are still developing. A business with a 14-day median lead-to-sale cycle should not compare the last three days with a fully matured period and conclude that campaign performance collapsed.
How Conversion time works
With Conversion time, GA4 anchors the attributed credit to the date when the conversion occurred. The marketing touchpoints still receive credit according to the selected attribution model, but their credit is shown inside the conversion's calendar period.
This is the more natural view for business-outcome reporting. It answers questions such as:
- How many purchases, qualified leads, bookings, or subscriptions happened this week?
- How much attributed conversion value was recorded during the month?
- Why does GA4's daily outcome curve differ from the CRM or ecommerce order curve?
- How many conversions continued to close after a campaign was paused?
The important consequence is that the interactions shown in a conversion-time report may have occurred before the selected date range. A paid social click from June can receive fractional credit for a purchase made in July and therefore appear in a July conversion-time report.
Conversion time is generally better for trend analysis and reconciliation with systems that store an order, lead, or opportunity by its actual completion timestamp. It is less suitable for judging the efficiency of a media cohort when the conversion delay is material, because the current period's outcomes can have been generated by an earlier period's spend.
Worked example: one conversion, two reporting clocks
Assume one customer follows this path:
June 26: Paid Social click → July 2: Paid Search click → July 6: purchase worth €1,000.
Data-driven credit: Paid Social receives 0.35 conversions and €350; Paid Search receives 0.65 conversions and €650.
| Touchpoint or outcome | Data-driven credit | Where it appears with Interaction time | Where it appears with Conversion time |
|---|---|---|---|
| Paid Social click on June 26 | 0.35 conversions and €350 | June 26 | July 6 |
| Paid Search click on July 2 | 0.65 conversions and €650 | July 2 | July 6 |
| Purchase on July 6 | 1.00 conversion and €1,000 in total | The purchase causes earlier interaction dates to be backfilled. | All attributed shares are reported on July 6. |
Now select the date range July 1–7.
- With
Conversion time, the report includes the full 1.00 conversion and €1,000 because the purchase occurred on July 6. Paid Social can still receive 0.35 credit even though its click happened before the selected range. - With
Interaction time, only the 0.65 Paid Search share falls inside July 1–7. The 0.35 Paid Social share belongs to June 26 and is outside the range.
Neither result is incorrect. The first report asks, “What converted during July 1–7?” The second asks, “What credit belongs to interactions that happened during July 1–7?”
Under Last click attribution, Paid Search would receive the entire 1.00 conversion. The timing choice would still matter: the conversion would be dated July 2 under Interaction time and July 6 under Conversion time.
Why the same date range can show different totals
A date range is not filtering the same object in the two modes:
Interaction timefilters the credited interactions by their dates. The associated conversions can happen after the range ends.Conversion timefilters conversions by the dates on which they occurred. Their credited interactions can happen before the range begins.
This creates two boundary effects. Interaction-time reporting can exclude part of an in-range conversion path because an earlier contributing touchpoint sits outside the range. It can also include credit from conversions completed after the range, provided their credited interactions occurred inside it. Conversion-time reporting does the reverse: it includes all credit for in-range conversions but can draw that credit from older interactions.
Across a sufficiently long, fully matured period that contains both the interactions and the resulting conversions, aggregate totals should usually move closer together. They may still fail to match exactly if the reports use different conversion actions, attribution models, channel eligibility, counting methods, windows, time zones, processing states, or data-quality adjustments.
Data-driven versus Last click is a separate axis
The cleanest way to understand the feature is as a two-by-two matrix:
| Attribution model and timing | Who receives credit? | Which date receives credit? | Typical use |
|---|---|---|---|
| Data-driven + Interaction time | Multiple contributing touchpoints can receive fractional credit. | Each fraction is placed on its own interaction date. | Multi-touch media cohort analysis and budget allocation. |
| Data-driven + Conversion time | The same contributing touchpoints receive fractional credit. | All fractions are placed on the conversion date. | Cross-channel outcome trends while retaining multi-touch credit. |
| Last click + Interaction time | The final eligible non-direct interaction receives 100%. | The last interaction date. | A deterministic benchmark aligned to the acquisition touchpoint. |
| Last click + Conversion time | The final eligible non-direct interaction receives 100%. | The conversion date. | A simple channel split aligned to sales or lead dates. |
Data-driven attribution uses account-specific path data and can distribute decimals or fractional credit. Google also notes that conversions can be reattributed for up to seven days after the conversion. This means a recent conversion-time report can change even though the conversion date itself is fixed, and an interaction-time report can change both because later conversions arrive and because existing credit is redistributed.
How the timing choice changes CPA and ROAS interpretation
The new report exposes metrics such as Cost per all conversions (by int. time), Cost per all conversions (by conv. time), Total revenue (by int. time), Total revenue (by conv. time), and corresponding ROAS metrics. The formulas may look familiar, but the business meaning changes with the reporting clock.
Interaction time is usually the cleaner media-efficiency view
Suppose a campaign spends €10,000 in June, stops on June 30, and produces additional sales during the first week of July. In an interaction-time report, those late sales are attributed back to the June interactions that generated them. June CPA and ROAS continue to mature, but the numerator and denominator describe approximately the same acquisition cohort.
This makes interaction time the better default for campaign evaluation, bid and budget reviews, creative comparisons, and post-campaign analysis—provided the selected period is old enough to include most of its conversion lag.
Conversion time is usually the cleaner business-outcome view
In the same example, a conversion-time report places the late sales in July. That accurately shows when the business received the orders, but July's revenue was generated partly by June's media spend. If little or no spend occurred in July, a conversion-time ROAS can look unusually strong, be undefined because the denominator is zero, or otherwise fail to represent the efficiency of the acquisition cohort.
This is not a flaw in the report. It is a reminder that revenue pacing and media efficiency are different questions. Conversion time is useful for operations, sales pacing, order volume, and finance-adjacent trend reporting. Interaction time is usually more defensible when reallocating advertising budget.
Which timing should you use?
| Reporting question | Recommended timing | Why | Main caution |
|---|---|---|---|
| Which campaign interactions generated the best eventual CPA or ROAS? | Interaction time |
Aligns attributed outcomes more closely with the media cohort and spend period. | Recent dates are incomplete until conversion lag matures. |
| How many purchases or leads occurred today, this week, or this month? | Conversion time |
Uses the date the outcome actually occurred. | The credited marketing interactions may come from earlier periods. |
How should we compare with Google Ads' standard All conv. column? |
Interaction time |
Google Ads' standard conversion columns are normally dated by the click or interaction. | Match conversion actions, model, window, channels, and time zone as well. |
How should we compare with All conv. (by conv. time) in Google Ads? |
Conversion time |
Both views are organized by the date the conversion happened. | Processing and configuration differences can still remain. |
| How should we compare daily GA4 outcomes with CRM or ecommerce orders? | Conversion time |
It is closest to the outcome timestamp stored by operational systems. | Normalize time zones, IDs, duplicates, refunds, and status definitions. |
| What should an executive dashboard show? | Both, separately labeled | One view explains business outcomes; the other explains acquisition efficiency. | Do not add or average the two timelines together. |
How to reconcile GA4 with Google Ads
The timing selector removes one major source of disagreement, but it does not guarantee automatic parity. Use the following sequence before treating a difference as a tracking error:
- [ ] Select the same conversion actions. The GA4 conversion report contains conversions shared with Google Ads, not every key event in the property.
- [ ] Match the metric scope. The new report uses
All conversions, which includes primary and secondary conversion actions. Do not compare it casually with a primary-onlyConversionscolumn. - [ ] Match the reporting clock. Compare interaction time with Google Ads
All conv.; compare conversion time withAll conv. (by conv. time). - [ ] Match the perspective. When
Google Analyticsis selected, one report-level attribution model can apply to the entire selected range. WhenGoogle Adsis selected, the report reflects the active model used for each conversion and that setting may have changed during the range. - [ ] Match channel eligibility. A paid-and-organic Analytics total can be higher than the Google Ads total because organic search, direct, email, or other channels may receive credit.
- [ ] Match counting methods and conversion windows. Timing does not compensate for different definitions of what counts or how long an interaction remains eligible.
- [ ] Match time zones. GA4 uses the property time zone; Google Ads uses the account time zone. A conversion near midnight can fall on different days.
- [ ] Allow for processing and conversion lag. Recent interaction-time periods are particularly likely to grow after the report date.
- [ ] Compare the Google Ads-attributed subtotal, not only the cross-channel grand total. Google says the Ads-attributed
All conversionssubtotal is the directly comparable figure.
A useful audit workflow is to begin with one conversion action, one linked Ads account, one campaign, and a mature date range. Reconcile that narrow slice before adding cross-channel totals or several conversion actions with different settings.
How to reconcile GA4 with a CRM or ecommerce platform
For CRM and order-system reconciliation, start with Conversion time. It is the only one of the two clocks designed to answer “what completed during this period?” Then check the remaining definition gaps:
- [ ] Use the same business event: submitted lead, qualified lead, closed opportunity, completed purchase, or another clearly defined status.
- [ ] Compare the actual conversion timestamp, not the click date, ingestion date, or report processing date.
- [ ] Normalize the GA4 property time zone and the CRM or store time zone.
- [ ] Use a stable identifier such as
transaction_id, order ID, lead ID, or opportunity ID where the implementation permits it. - [ ] Remove duplicate events and confirm whether repeated actions are intentionally counted.
- [ ] Account for cancellations, returns, value adjustments, spam leads, and post-conversion qualification rules.
- [ ] Separate observed records from modeled conversions where modeling affects the report.
- [ ] Allow for offline upload and processing delays before closing the reconciliation period.
Even after these checks, an attributed analytics report is not an accounting ledger. GA4 is designed to allocate marketing credit; a CRM or commerce database is designed to store operational records. Use conversion time to align the dates, but use transaction-level source data for financial close and legal reporting.
Recommended reporting workflow
For most organizations, the strongest approach is not to choose one clock permanently. Build a two-layer reporting workflow:
- Business-outcome layer: report leads, purchases, bookings, conversion value, and closed revenue by
Conversion time. Use this layer for daily and weekly pacing, CRM reconciliation, inventory or staffing decisions, and management reporting. - Media-performance layer: report conversions, conversion value, CPA, and ROAS by
Interaction time. Use a maturity buffer based on the observed conversion lag before making budget decisions. - Attribution layer: compare
Data-drivenandLast clickinside each clock. This isolates the effect of the credit model from the effect of the calendar. - Reconciliation layer: maintain a compact table of conversion action, counting method, window, eligible channels, model, time zone, and reporting clock for every recurring dashboard.
A practical monthly review can therefore contain four clearly labeled figures:
| View | What it tells stakeholders |
|---|---|
| Data-driven, conversion time | Which channels receive multi-touch credit for outcomes completed during the month. |
| Last click, conversion time | A deterministic benchmark for the same completed outcomes. |
| Data-driven, interaction time | How the month's marketing interactions are expected to perform after attribution and lag. |
| Last click, interaction time | A simple interaction-dated benchmark that is easier to reconcile with familiar Ads reporting. |
This layout prevents a common reporting failure: attributing a difference to the model when it was actually caused by the date basis, or attributing it to the date basis when the reports used different channel scopes.
Availability, data scope, and limitations
As of July 2026, the conversion reporting experience remains a gradual beta rollout. The following constraints are important:
- The property must collect data, contain at least one key event, be linked to Google Ads, and have a Google Ads conversion created from an Analytics event or key event.
- The Conversion performance report is available in the desktop version of Google Analytics.
- The report includes data from March 15, 2024 onward, but a newly created or newly shared conversion does not receive automatic historical conversion data for periods before it existed in the shared workflow.
- The report contains only conversions shared with Google Ads. Standard GA4 reports continue to use key events and do not automatically show these Google Ads conversion objects.
- Data is not populated for subproperties or roll-up properties; the source property must be used.
- Properties with more complex Google Ads linking arrangements may not be supported.
- For some large properties, conversions that cannot be attributed to a channel can be removed from the total, with a data-quality notice shown in the interface.
- When paid and organic channels are eligible, GA4's cross-channel total can exceed the Google Ads total even when the Google Ads-attributed subtotal matches.
For automation, Google added conversion-reporting support to the Google Analytics Data API v1 alpha in 2026, including conversion action filters and Data-driven or Last click model selection. Property eligibility is still limited. BigQuery Export remains a raw-event export rather than a ready-made copy of the processed conversion attribution report, so a custom warehouse query should not be expected to reproduce the interface's Data-driven attribution row for row.
What changed compared with Universal Analytics
Universal Analytics had Multi-Channel Funnels and a Model Comparison Tool. Analysts could compare models and adjust a lookback window for the conversion paths that led to goals and transactions. Those reports were fundamentally conversion-path reports centered on completed conversions.
Universal Analytics did not document the same report-level switch for moving already-attributed credit between an interaction-date timeline and a conversion-date timeline. Google Ads did offer conversion-time columns, but the distinction lived mainly across products rather than inside one integrated Analytics conversion-reporting workflow.
GA4's practical improvement is therefore not a new attribution model. It is the ability to look at the same conversion system through two legitimate time dimensions and to make the choice explicit. That helps analysts explain why advertising platforms and business systems can both be internally correct while presenting different daily or monthly curves.
What the new timing control does not solve
- It does not prove incrementality. Attribution allocates credit among observed or modeled touchpoints; it does not show what would have happened without the marketing activity.
- It does not repair missing or duplicated tracking. Consent gaps, broken tags, duplicated purchase events, bad identifiers, and incorrect timestamps remain implementation problems.
- It does not make every GA4 and Google Ads number identical. Model, channel scope, counting, windows, time zones, primary/secondary status, and processing can still differ.
- It does not change bidding simply because the report view changed. The selector is a reporting perspective; conversion-action settings and campaign optimization controls must be managed separately.
- It does not turn GA4 into a financial ledger. Attributed revenue should still be reconciled against the source-of-truth commerce or CRM system.
Conclusion
The new GA4 conversion attribution reporting is useful because it makes a hidden reporting decision visible. Interaction time answers which marketing activity produced eventual outcomes. Conversion time answers when those outcomes actually happened. The model decides who receives credit; the clock decides where that credit appears on the calendar.
For media optimization, use a mature interaction-time view. For sales, lead, and revenue pacing, use conversion time. For stakeholder reporting, show both and explain the distinction in the report label. Once those clocks are separated, many apparent discrepancies between GA4, Google Ads, and CRM data become understandable rather than mysterious.
Methodology and sources
This article is based primarily on Google's official documentation for cross-channel conversion reporting, the Conversion performance report, conversion and key-event terminology, attribution settings, Data-driven attribution, Google Ads conversion-date columns, conversion lag, Data API conversion reporting, BigQuery Export, and the legacy Universal Analytics Multi-Channel Funnels reports. The worked examples are simplified illustrations created to explain the documented date-assignment logic; their fractional attribution weights are hypothetical.
- Google Analytics: Cross-channel conversion reporting in Analytics
- Google Analytics: Conversion performance report (beta)
- Google Analytics: What's new in Google Analytics
- Google Analytics: Key event attribution models report
- Google Analytics: Get started with attribution
- Google Analytics: Select attribution settings
- Google Analytics: Creating and managing conversions
- Google Analytics: Conversions versus key events
- Google Analytics: Create Google Ads conversions based on Analytics key events
- Google Ads: Understand your conversion tracking data
- Google Ads: Find out how long it takes for customers to convert
- Google Analytics Data API changelog
- Google Analytics: BigQuery Export
- Universal Analytics legacy documentation: About Multi-Channel Funnels
- Universal Analytics legacy documentation: Model Comparison Tool
This article is for analytics and operational guidance only. metricfixer is not affiliated with Google. Google Analytics and Google Ads beta interfaces, eligibility rules, terminology, metric definitions, and attribution behavior may change after publication. Attribution reports allocate statistical or rules-based credit and should not be treated as proof of causal incrementality or as a substitute for CRM, ecommerce, or accounting records. Verify the settings and source data used by your own property before making budget or revenue decisions.