
Published Aug 1, 2026
Why a GA4 Event Appears in DebugView and Realtime but Not in Reports
Excerpt: Why a GA4 event can appear in Tag Assistant, DebugView, and Realtime but remain absent from the Events report, Explorations, custom dimensions, or key-event reporting—and how to diagnose the exact stage where it stops.
Category: Analytics & Conversion Tracking · By Mikalai Sasau
An event can fire in Google Tag Manager, appear in GA4 DebugView and Realtime, and still be missing from the Events report, Explorations, custom dimensions, or key-event reporting. This does not necessarily mean that GA4 lost the event. These interfaces represent different stages of collection, filtering, processing, and report configuration.
Practical default: treat Tag Assistant as proof that tag logic executed, DebugView and Realtime as proof that GA4 received recent data, and standard reports as proof that the event survived filters and completed processing. For a new event, allow up to 24 hours for the Events report and up to 24–48 hours for many reports, Explorations, and newly registered custom definitions—but do not wait blindly if the event was sent only in debug mode or the GTM change was never published.
Executive summary
The most common mistake in this troubleshooting scenario is to treat every GA4 interface as a different view of the same finished dataset. It is not. Tag Assistant, DebugView, Realtime, standard reports, Explorations, and key-event reports answer different questions.
- Tag Assistant confirms that a tag or trigger ran in the browser and shows what the current GTM workspace attempted to send. In Preview mode, it can test an unpublished container draft.
- DebugView shows events carrying a debug signal as Analytics collects them from a development device.
- Realtime shows a limited, fast view of activity from roughly the last 30 minutes.
- The Events report depends on normal GA4 processing and can take up to 24 hours to show a newly triggered event.
- Explorations and custom reports use processed reporting data and require a registered custom dimension or metric when the field is a custom parameter.
- Key-event reporting begins only after the event is marked as a key event; the setting does not convert earlier occurrences retroactively.
Google’s documentation explicitly separates collection confirmation from reporting availability. The collection troubleshooting guide says many reports and Explorations can take 24–48 hours to process, while the Events report documentation says event data can take up to 24 hours to appear. Google’s current data-freshness documentation also distinguishes Realtime, intraday, and daily processing intervals.
However, waiting is not always the answer. If the test event carried debug_mode and an active developer-traffic filter excludes debug traffic, the event can remain visible in DebugView while being permanently excluded from processed reports. If a GTM tag was tested only in Preview mode, the draft may work for the tester while regular visitors still receive the previously published container. If a custom parameter was never registered as a custom definition, GA4 may show the value in DebugView or Realtime without making it selectable in an Exploration.
The correct diagnostic method is therefore a timeline: identify the last stage at which the event is visible, then test only the next gate.
The GA4 event lifecycle: from browser action to report row
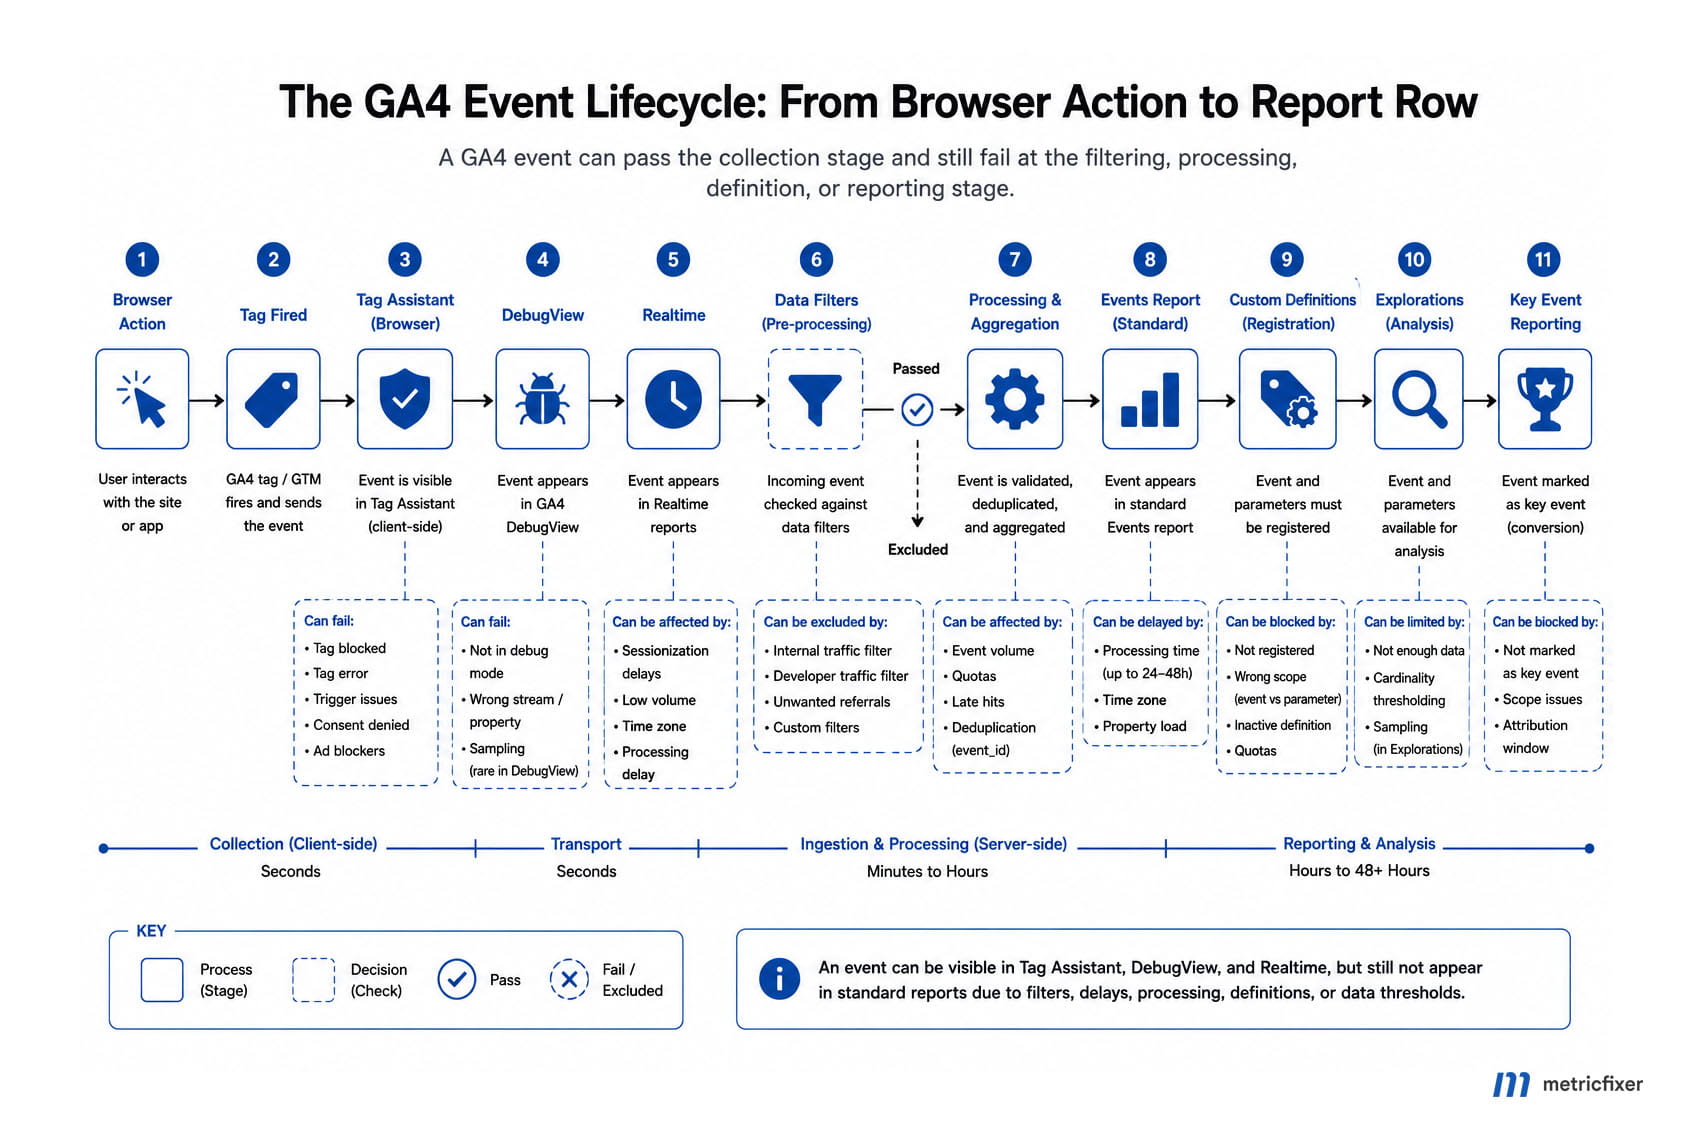
GA4 event lifecycle: user action in the browser → tag or GTM trigger executes → request is sent to the intended GA4 property → DebugView or Realtime confirms recent collection → GA4 evaluates active data filters → intraday and daily processing build reporting data → the event appears in the Events report → registered custom definitions expose custom parameters in reports and Explorations → key-event status applies to qualifying occurrences from the time the event is marked.
Stage 0: the configuration must exist outside Preview mode
GTM Preview mode deliberately behaves as if the current workspace draft were deployed. Google describes it as a way to browse the site with the draft configuration before publication. This makes Preview mode ideal for QA, but it also creates a common false conclusion: “Tag Assistant shows the event, so all visitors must be sending it.”
They are not, unless the relevant container version has been published to the production environment. A tester can see the tag fire in Tag Assistant, send a debug event, and find it in DebugView while the public site still serves the old container. Google’s Preview and debug documentation states that the draft is visible only in the browser using Preview mode, and its publishing documentation says workspace changes become operational only when the container is published.
This is why the publication timestamp matters. Record the GTM version, publish time, environment, and GA4 property timezone before comparing reports. Data from before the deployment will not be created retroactively simply because the tag was published later.
Stage 1: Tag Assistant proves execution, not completed GA4 processing
Tag Assistant can prove that the browser reached a trigger and that a GA4 event tag attempted to run. It can also show event parameters, configuration dependencies, consent state, and tag sequencing. This is valuable implementation evidence, but it is still browser-side evidence.
A fired tag does not by itself prove all of the following:
- the request used the intended
G-measurement ID; - the request was not blocked, cancelled, or redirected incorrectly;
- the event reached the intended property rather than a test property;
- the event survived a server-side transformation or routing rule;
- the event will pass GA4 data filters;
- the event will become a reportable custom dimension;
- the event will be counted as a key event.
For setups that combine Google tags, GTM, consent logic, or server-side routing, it is useful to audit which configuration layer actually controls the event. metricfixer’s review of Google Tag Manager and Google tag prefix logic explains why apparently similar G-, GT-, GTM-, AW-, and DC- identifiers can represent different configuration and destination roles.
Stage 2: DebugView and Realtime confirm collection
DebugView displays events and user properties that Analytics collects from a device when debug mode is enabled. It provides a seconds stream, recent-minute history, event parameters, and current user properties. Tag Assistant normally adds the debug signal for the tester, while an implementation can also send debug_mode explicitly.
Realtime is broader but still intentionally limited. It focuses on recent activity, usually from the last 30 minutes, and uses a smaller set of dimensions and metrics than processed reports. Google also warns that Realtime and DebugView perform limited attribution analysis, so acquisition reports remain the better source for final traffic-source analysis.
When the event appears in DebugView or Realtime, the strongest supported conclusion is:
GA4 has received recent event data for this property and can expose it through a low-latency interface.
That is more meaningful than a Tag Assistant firing status, but it is not yet proof that the event will be retained in normal reporting data.
Stage 3: data filters decide whether the event is processed
GA4 data filters are not cosmetic report filters. An active exclusion filter can prevent incoming event data from being processed at all. Google states that excluded data is permanently unavailable in Analytics and BigQuery, and that data filters work only from their creation forward.
Two filters are especially relevant:
- Developer traffic: can exclude events collected while debug mode is enabled.
- Internal traffic: can exclude events associated with configured internal IP rules.
This produces the classic symptom: the event is visible in DebugView, but never appears in ordinary reports. That may be the intended behavior. Google’s developer-traffic filter guide specifically describes allowing developers to use DebugView while preventing their debug activity from appearing in reports.
Filter state matters:
| Filter state | What GA4 does | Diagnostic consequence |
|---|---|---|
| Inactive | Does not evaluate matching incoming data. | The filter is not the cause of missing events. |
| Testing | Retains matching data and labels it with the Test data filter name dimension. | You can validate the rule in an Exploration before making exclusion permanent. |
| Active | Applies the include or exclude rule to new incoming data. | Excluded events are permanently removed from processed reporting data. |
Google notes that a data filter can take roughly 24–36 hours to apply fully. This creates another timing trap: a team may activate a developer or internal filter and then compare tests performed before and after the filter became effective as though they were equivalent.
Stage 4: Realtime data enters intraday and daily processing
After collection and filtering, GA4 processes the event into reporting datasets. Google currently documents several freshness intervals:
| Processing layer | Typical availability | What it is useful for |
|---|---|---|
| Realtime | Typically a few minutes; often faster | Confirming current collection and monitoring a live release |
| Standard-property intraday | Typically about 2–6 hours | Early same-day reporting, subject to later adjustment |
| Daily processing | Often 12–24+ hours depending on property size and data conditions | More complete reporting data |
| General report and Exploration stabilization | Allow up to 24–48 hours | Final troubleshooting before treating the issue as persistent |
The Events report has a more specific expectation: Google says data about an event can take up to 24 hours from the time the event was triggered. During the broader 24–48-hour processing window, totals and attribution can still change.
This means a same-day comparison can legitimately show:
- one event in DebugView;
- one event in Realtime;
- zero rows for that event in the standard Events report;
- no usable custom parameter in an Exploration.
When the event remains missing after the documented processing window, move to configuration checks instead of repeatedly sending more debug events.
Stage 5: the Events report confirms processed event data
The standard Events report is the first practical confirmation that an event has completed enough processing to participate in ordinary reporting. A missing event at this stage can have several explanations besides data loss:
- the report date range does not include the property date assigned to the event;
- the event was sent to another GA4 property or stream;
- a report comparison or filter hides it;
- the event name differs by case, for example
generate_leadandGenerate_Lead; - the report was customized or removed from the visible report collection;
- the event was filtered before processing;
- the event exists only in an unpublished Preview-mode test;
- processing has not finished.
GA4 event names are case-sensitive. A team searching for form_submit will not find an event collected as Form_Submit under the expected row because GA4 treats them as separate event names. Google’s event naming rules also require event names to start with a letter and use letters, numbers, and underscores rather than spaces.
Stage 6: custom parameters need reporting definitions
A custom parameter can be visible when you open an event in DebugView or Realtime and still be unavailable as a dimension in Explorations. This is expected. Collecting a parameter and registering a reporting definition are separate actions.
Google’s event-parameter documentation states that custom event parameters require corresponding custom dimensions or metrics to become reportable. For categorical values such as form type, content category, button label, or payment method, create a custom dimension. For a quantitative value that should be aggregated, create a custom metric.
The definition must match the data model:
| Collected field | Correct reporting definition | Common mistake |
|---|---|---|
| Parameter attached directly to an event | Event-scoped custom dimension or metric | Creating a user-scoped definition |
| Persistent user property | User-scoped custom dimension | Sending it only as a one-event parameter |
Custom field inside the ecommerce items array | Item-scoped custom dimension | Registering the same name at event scope |
| Numeric quantity intended for summation or averaging | Custom metric | Creating a categorical dimension and expecting numeric aggregation |
The parameter or user-property name must match the implementation exactly. Display names in the GA4 interface can be human-readable, but the underlying event parameter remains a technical identifier such as form_type. User-property names are explicitly case-sensitive, and event names are also case-sensitive; operationally, parameter naming should be treated with the same exact-match discipline.
Google says an event-scoped custom dimension can be added to reports after 24–48 hours from the point when the custom data was sent and the custom dimension was created. The safest implementation practice is therefore to register required custom definitions before production rollout and to treat them as forward-looking. Do not assume that creating a definition today will reconstruct a complete historical breakdown for parameter values sent before the definition existed.
High cardinality is a separate reporting issue. A parameter such as a unique order ID, full URL with many query strings, timestamp, or user identifier can generate hundreds or thousands of distinct values. GA4 may condense less common values into the (other) row when row limits are reached. This does not normally erase the parent event, but it can make the parameter appear incomplete. Google advises against unnecessary high-cardinality custom dimensions and defines dimensions with more than 500 unique daily values as high-cardinality in this reporting context.
Stage 7: key-event status is a configuration applied from that point forward
An event does not need to wait for a large volume of traffic before it can become a key event. Google’s current interface supports two paths:
- mark an existing event from the recent-events list after GA4 has processed it;
- create or predefine a new event and mark it as a key event before the first production occurrence.
This is important when a newly implemented event does not yet appear in the recent-events list. The team can define the exact event name in advance rather than waiting for the list to populate. Google’s key-event setup guide says marking affects reports from the time of creation and can take up to 24 hours to appear in standard reports. Realtime key-event cards normally update within minutes after a qualifying occurrence.
If the interface does not allow the action, check permissions. Creating or marking key events requires an appropriate property role; users with read-only access cannot change the configuration. Also verify the exact spelling and case of the predefined event name. Marking lead_submit will not mark Lead_Submit.
What each interface proves—and what it does not
| Interface | What a positive result proves | What it does not prove | Typical timing |
|---|---|---|---|
| Tag Assistant | The browser-side tag and trigger executed in the tested configuration. | That the production container is published, the request reached the intended property, or the event will survive filters. | Immediate |
| DebugView | GA4 collected a debug-signalled event from the selected device. | That developer traffic is included in processed reports. | Seconds to minutes |
| Realtime | GA4 received recent activity and can expose it in a low-latency dataset. | Final attribution, full dimension support, or completed daily processing. | Usually within minutes |
| Events report | The event has entered processed standard reporting data. | That every custom parameter is reportable or that the event is a key event. | Up to 24 hours |
| Exploration | The selected processed dimensions and metrics are available for the chosen date range and technique. | That unregistered custom parameters can be queried automatically. | Often 24–48 hours for new data or definitions |
| Key-event reports | Occurrences after key-event configuration are being processed as key events. | That earlier historical occurrences were converted into key events. | Realtime within minutes; standard reports up to 24 hours |
Why an event is visible in DebugView and Realtime but missing from the Events report
1. The event is still inside the normal processing window
This is the most common benign cause. Use Realtime to confirm collection, then compare the event in the standard Events report after the property has had a full processing cycle. A practical schedule is:
- check Realtime immediately;
- check the Events report after 6–12 hours for an early signal;
- allow up to 24 hours before treating the Events report absence as abnormal;
- allow up to 48 hours for Explorations, custom dimensions, and reports that combine more processing layers.
Repeatedly refreshing the Events report during the first hour does not accelerate processing and can distract from more important checks such as filter state and container publication.
2. The event is debug traffic and the developer filter is active
This is the most direct explanation when an event is visible in DebugView but absent from normal reports. The debug signal can come from Tag Assistant, GTM Preview mode, a Google tag configuration, or an event-level debug_mode parameter. If the property has an active exclude filter for developer traffic, the event is intentionally discarded from processed data. Google also notes that setting debug_mode to false does not disable debug mode; the field must be removed from the configuration or event.
Do not disable a governance filter simply to make a test event appear in production reports. Instead, run a second controlled test outside Preview mode and without the debug signal, or keep the filter in Testing state while validating the implementation.
3. The tester is also classified as internal traffic
A developer may pass the debug test and still be excluded by a separate internal-traffic filter based on the office, VPN, agency, or home IP range. Check both filter types. The event can match more than one exclusion rule.
A good release test uses two sessions:
- a debug session for implementation detail;
- a clean production session outside Preview mode, ideally from a network not classified as internal.
4. The event exists only in the GTM workspace draft
Preview mode loads the draft for the tester. It does not publish that draft to the site. After publishing, exit Preview mode, open a new browser session, and test the public site again. Confirm the production container version and event timestamp rather than relying on memory.
Google’s own tag-setup troubleshooting guide warns that configured GTM changes must be submitted and published before they generate normal Analytics data.
5. The report is looking at the wrong property, date, stream, or filter
Realtime testing often involves several browser tabs and properties. Confirm:
- the
G-measurement ID used by the event; - the property selected in Admin and Reports;
- the web or app stream;
- the property timezone;
- the report date range;
- active comparisons and report filters;
- the exact event name and letter case.
An event triggered close to midnight can fall on a different property date than the tester expects. A report customized with a filter or comparison can also hide a valid event even though the underlying property contains it.
6. Thresholding is hiding a report row—but only in specific contexts
Thresholding is frequently blamed for every missing GA4 row, but that is too broad. Google applies data thresholds to protect user privacy when a report or Exploration includes sensitive or identity-revealing combinations, especially demographic data, audience-derived data, or search-query information with low user counts.
When thresholding affects a report, the data-quality indicator should say that one or more cards are limited until minimum aggregation thresholds are met. Increasing the date range, removing demographic or audience dimensions, and simplifying filters can reduce the likelihood of thresholding.
There is no published universal minimum number of event occurrences required for an ordinary event name to become valid in the basic Events report. A low-volume event can appear after processing. Therefore, if a simple unfiltered Events report has no data-quality warning, thresholding is usually a weaker explanation than processing delay, an active data filter, the wrong property, or an unpublished container.
7. “Minimum data” is being confused with the (other) row
Thresholding and high cardinality are different mechanisms:
- Thresholding withholds data to protect privacy when user counts are too low for certain report combinations.
- The
(other)row groups less common dimension values when reporting row limits are exceeded.
A unique parameter such as transaction_id, full page URL, form submission ID, or timestamp is more likely to create a high-cardinality problem than a privacy-threshold problem. The event can still be present while individual parameter values are grouped.
Why a parameter is visible in Realtime but missing from Explorations
Use this sequence:
- Confirm the field type. Is it an event parameter, user property, or item field?
- Check for a predefined GA4 dimension. Do not create a custom definition when GA4 already exposes the field natively.
- Create the correct custom definition. Match the underlying parameter name exactly and choose event, user, or item scope correctly.
- Send a new event after the definition exists. This avoids relying on historical backfill assumptions.
- Wait 24–48 hours. Then import the new dimension into the Exploration.
- Check the date range and data retention. Explorations use retained user- and event-level data and may not cover older dates available in aggregated standard reports.
- Check cardinality and threshold indicators. A field can exist but be grouped or withheld in a particular query.
A parameter visible in Realtime is evidence that the implementation sent the key-value pair. It is not an automatic promise that GA4 will create a reusable reporting dimension. Registration is the schema step that connects raw collection to the reporting interface.
Why the event cannot be marked as a key event
| Symptom | Likely explanation | Recommended action |
|---|---|---|
| The event is absent from Recent events. | It has not completed processing or exists only as excluded debug traffic. | Predefine the event name as a key event instead of waiting for the recent-events row. |
| The star or create control is unavailable. | The user lacks the required property role. | Ask an Administrator to grant the appropriate role or make the change. |
| The key event appears in Realtime but not standard reports. | Key-event reporting is still processing. | Allow up to 24 hours. |
| Earlier events are not counted as key events. | Key-event marking is not retroactive. | Analyze prior occurrences as ordinary events; use key-event metrics only from the configuration time onward. |
| A similarly named event remains ordinary. | Event names are case-sensitive or spelled differently. | Match the exact production event name. |
| The property has reached a configuration limit. | No additional key-event configuration can be created. | Review unused configurations and current GA4 property limits before adding another. |
Diagnostic matrix: find the first broken gate
| Observed result | What it suggests | Next check |
|---|---|---|
| Tag Assistant shows the tag, but DebugView and Realtime do not. | The browser logic ran, but GA4 collection is not confirmed. | Check the measurement ID, consent state, request blocking, network request, server-side routing, and property selection. |
| DebugView shows the event, but standard reports never do. | Debug traffic may be excluded, or the event has not completed processing. | Check developer and internal data filters, then run a non-debug production test. |
| Realtime shows the event, but the Events report does not on the same day. | Normal processing delay is still plausible. | Wait up to 24 hours and verify the property date range. |
| Realtime shows a parameter, but Explore cannot select it. | The custom definition is missing, new, or configured with the wrong scope. | Register the exact parameter with the correct scope, send a new event, and wait 24–48 hours. |
| The event is visible only while GTM Preview is connected. | The change may be unpublished or assigned to the wrong GTM environment. | Publish the production version and retest without Preview mode. |
| The event row exists, but rare parameter values are absent. | High cardinality or the (other) row may be grouping them. | Reduce uniqueness, use existing dimensions, or query an appropriate export instead of registering IDs as dimensions. |
| A report shows a data-quality warning and low totals. | Thresholding may be withholding rows. | Expand the date range and remove demographic, audience, or search-query breakdowns. |
| The event cannot be selected as a key event. | The recent-events list has not updated, permissions are insufficient, or a limit has been reached. | Use preemptive key-event creation, verify access, and review configuration limits. |
A reliable release-test protocol
Use one named test event and one low-cardinality parameter. Avoid testing with a production event name that already has large historical volume unless you can isolate the test clearly.
- Record the configuration. Note the GA4 property, stream, measurement ID, property timezone, GTM workspace, container version, environment, event name, parameter names, and current data-filter states.
- Register reporting fields first. Create required custom dimensions or metrics before the production test.
- Run the debug test. Use Tag Assistant to confirm trigger logic, parameter values, consent state, and destination.
- Confirm collection. Find the event in DebugView and Realtime. This establishes that GA4 received it.
- Publish the container. Create a named GTM version with a clear deployment note.
- Run a clean production test. Exit Preview mode, use a fresh session, remove the debug signal, and avoid an IP address classified as internal where possible.
- Check filters. Confirm that developer and internal filters are not actively excluding the production test.
- Check the Events report after processing. Allow up to 24 hours and use a date range that includes the property date.
- Check the custom parameter after processing. Allow up to 24–48 hours, import the custom dimension into a new Exploration, and verify the exact scope.
- Test key-event behavior separately. Mark or predefine the event as a key event, then generate a new occurrence after the configuration time.
- Document the result. Save the deployment timestamp and first successful processed event so future report comparisons have a reliable boundary.
For consent-aware or server-side implementations, include the consent path in this protocol. The related metricfixer review GA4 Consent Changes and Server-Side GTM: What Analytics Teams Should Check Now explains why a server container does not replace browser-side consent signals and why different test sessions can produce different payloads.
Common misconceptions
“Tag fired” means “GA4 stored the event”
No. It means the tag logic executed. Collection must still be confirmed, and processed reporting is a later stage.
“Realtime is the live version of the Events report”
No. Realtime is a low-latency reporting surface with limited dimensions, metrics, and attribution. It is designed for monitoring, not final reconciliation.
“A parameter visible in DebugView automatically becomes a dimension”
No. Custom parameters require custom definitions unless a predefined GA4 dimension already maps to the parameter.
“GA4 needs a minimum number of events before listing the event”
Google does not publish a universal activation threshold for ordinary event names in the basic Events report. Privacy thresholds apply to specific reporting contexts, not to every low-volume event.
“Thresholding and the (other) row are the same problem”
No. Thresholding withholds data for privacy. The (other) row groups values because of reporting row limits and high cardinality.
“Marking an event as key will update the past”
No. Key-event status applies from the time of configuration. Earlier occurrences remain ordinary events.
“Preview mode proves the production deployment”
No. Preview mode is specifically designed to test a draft before it is published.
Recommended operating rules for analytics teams
- [ ] Register required custom dimensions and metrics before the event launch.
- [ ] Keep debug traffic and production verification as two separate tests.
- [ ] Use Testing state before activating a permanent data filter.
- [ ] Record the GTM publication time and GA4 property timezone for every measurement release.
- [ ] Predefine important key events instead of waiting for the recent-events list.
- [ ] Avoid high-cardinality custom dimensions for IDs, timestamps, and full URLs.
- [ ] Check the data-quality indicator before blaming thresholding.
- [ ] Allow the documented processing window, but escalate after it with a structured gate-by-gate test.
- [ ] Retest without Preview mode after every production publication.
- [ ] Treat DebugView and Realtime as collection diagnostics, not as final reporting truth.
Methodology and sources
This article is based on a review of current Google Analytics and Google Tag Manager documentation available on 1 August 2026. The research focused on the separation between browser execution, GA4 collection, debug and Realtime interfaces, active data filters, intraday and daily processing, the Events report, custom definitions, Explorations, thresholding, high cardinality, GTM Preview and publication, and key-event configuration. Google does not publish a universal minimum event count for inclusion in the basic Events report; the article therefore distinguishes documented privacy thresholds from the unsupported assumption that every new event needs a fixed activation volume.
- Google Analytics Help: Monitor events in DebugView
- Google Analytics Help: Realtime report
- Google Analytics Help: Confirm that you are collecting data
- Google Analytics Help: Events report
- Google Analytics Help: Data freshness
- Google Analytics Help: Data freshness and service-level constraints
- Google Analytics Help: Data filters
- Google Analytics Help: Filter out developer traffic
- Google Analytics Help: Filter out internal traffic
- Google Analytics Help: About custom dimensions and metrics
- Google Analytics Help: Create event-scoped custom dimensions
- Google Analytics Help: Create user-scoped custom dimensions
- Google Analytics Help: Create item-scoped custom dimensions
- Google for Developers: Set up event parameters
- Google Analytics Help: Mark events as key events
- Google Analytics Help: About data thresholds
- Google Analytics Help: About the other row
- Google Analytics Help: Event naming rules
- Google Tag Manager Help: Preview and debug containers
- Google Tag Manager Help: Publishing, versions, and approvals
- Google Analytics Help: Troubleshoot tag setup on your website
This article is for technical and operational information only. Google Analytics, Google Tag Manager, report interfaces, processing behavior, limits, and documentation can change after publication. metricfixer is not affiliated with Google. Always validate critical measurement changes in the current product interface and official documentation before using the data for business, advertising, or compliance decisions.