
Published Aug 18, 2026
Why a Tag Fires in GTM Preview Mode but Not for Real Visitors
A network-first diagnostic workflow for finding why a Google Tag Manager tag fires in Preview Mode but fails for ordinary visitors, covering live versions, debug side effects, forms, consent, cookies, CSP, blockers, navigation timing, and platform processing.
Category: Analytics & Conversion Tracking · By Mikalai Sasau
A tag that appears to fire in Google Tag Manager Preview Mode but fails for ordinary visitors is not a single GTM problem. It is a break somewhere between the published container, the real browser event, consent, page navigation, the outgoing network request, and the destination platform. This guide provides a systematic way to find the first broken link instead of changing triggers at random.
Practical default: reproduce the action in a clean production session with Chrome DevTools open, Preserve log enabled, and no GTM Preview connection. Treat the Network panel—not the green “Tags Fired” state—as the first proof that data actually left the browser.
Executive summary
Google Tag Manager Preview Mode loads the current workspace draft as if it were deployed, while ordinary visitors normally receive the version published to the live environment. A successful preview therefore proves that a draft configuration evaluated a trigger in one debug browser. It does not prove that the same container version, browser state, event, consent status, request timing, or vendor response exists in production.
The most important distinction is between tag execution and measurement delivery. Tag Assistant can show that an event occurred, a trigger matched, and a tag started running. The browser may still cancel the request during navigation, block it under a Content Security Policy, suppress it through an extension or privacy feature, or send it to the wrong property. Even a completed request does not prove that the destination platform processed, attributed, deduplicated, and displayed the event in the report being checked.
The correct diagnostic order is:
- confirm the correct container, version, environment, and site release are live;
- repeat the same business action without Preview Mode;
- verify that the same browser or
dataLayerevent exists in production; - check consent at the exact moment that event is evaluated;
- use the Network panel to confirm that the request was created, sent, and completed;
- only then investigate the vendor’s collection, processing, and reporting layers.
This order matters because each stage depends on the previous one. There is no value debugging GA4 reports when the browser never sent a GA4 request, and there is no value rewriting a form trigger when the live site is still loading an older GTM version.
What Preview Mode actually proves—and what it does not
Google describes Preview Mode as a way to browse a site with the current container draft loaded as though it were deployed. The debug interface is tied to the browser that started or received the preview session and is not shown to regular visitors. Publishing is a separate action: workspace changes become operational on the site only when the relevant version is published to the intended environment.
Evidence chain: business action occurs → the application or browser produces an event → GTM evaluates the trigger → the tag executes → the browser creates a request → the request leaves and reaches an endpoint → the platform accepts and processes it → the event appears in the intended report.
| Observed evidence | What it proves | What it does not prove |
|---|---|---|
| The event is visible in Tag Assistant | The connected debug browser exposed that event to the previewed container. | That the same event exists for a visitor without Preview Mode. |
| The tag appears under “Tags Fired” | GTM evaluated the tag as eligible and invoked its template or code. | That a request left the browser, completed, or contained correct values. |
| A request appears in Network | The browser created a request associated with the action. | That it completed successfully or reached the intended property. |
The request completed with 2xx or 204 | The endpoint returned a success-class response to that request. | That the event will be attributed, retained, deduplicated, or visible in every report. |
| The event is visible in a vendor debug or realtime surface | The platform received and exposed the event in that diagnostic layer. | That standard reports have finished processing or that conversion rules match it. |
For GA4, this distinction continues after collection. An event can be present in DebugView or Realtime and still be absent from a standard report because collection, processing, custom-definition registration, filters, and reporting are separate stages. The full reporting lifecycle is covered in metricfixer’s guide to GA4 events that appear in DebugView but not in reports.
Diagnostic decision tree
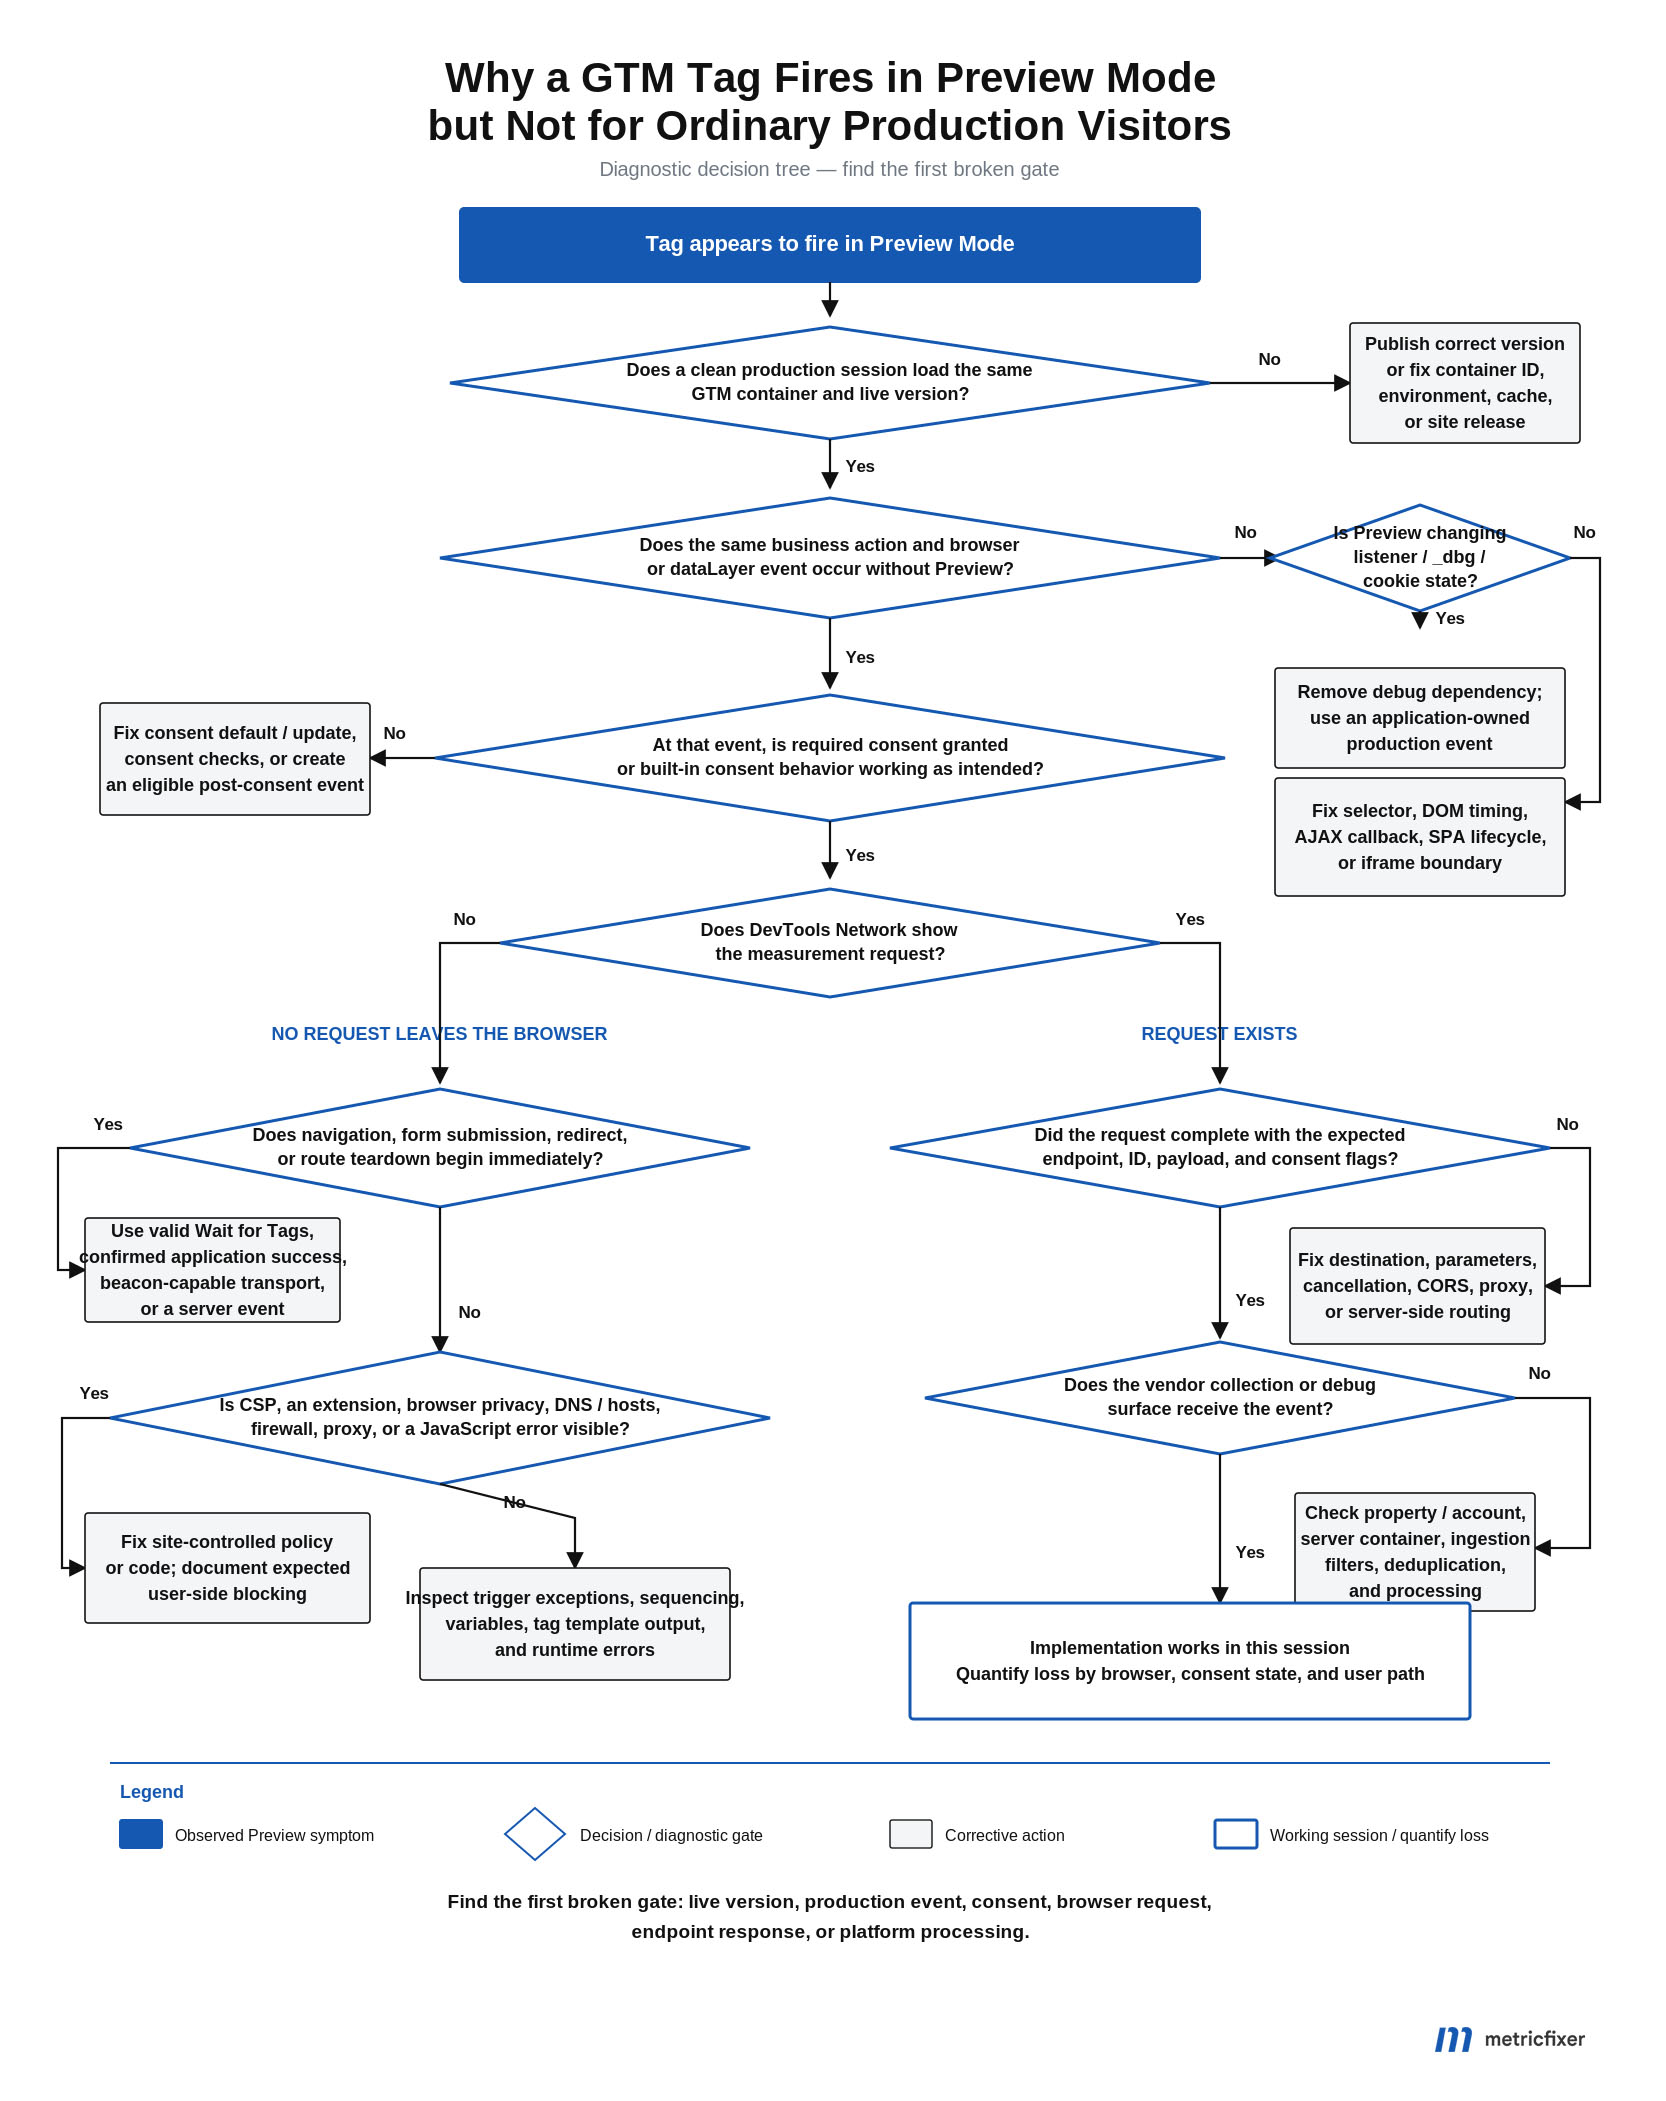
The diagnostic algorithm: find the first broken gate
Start with one precise test case. “The tag does not work” is too broad. Record the page URL, action, expected event name, expected endpoint or measurement ID, consent choice, browser, time, and expected business result. Then move through the gates below in order.
Gate 1: Is the correct version actually live?
The highest-value first check is also the least technical: verify that the change being tested in Preview Mode has been published to the production environment. Preview can load an unpublished workspace, an older saved version, a custom environment, or a shared preview. Google’s environment documentation notes that the built-in Live environment always points to the currently published version, while publishing to a custom environment does not update Live.
Check all of the following:
- [ ] The production page contains the expected
GTM-XXXXXXXcontainer ID. - [ ] The same ID is not duplicated by a CMS plugin, theme, consent platform, or hard-coded snippet.
- [ ] The intended workspace was submitted and published—not merely saved as a version.
- [ ] The version was published to Live, not only to Dev, QA, Latest, or a custom environment.
- [ ] The site release containing the GTM snippet or supporting
dataLayercode reached production. - [ ] A CDN, edge cache, full-page cache, service worker, or old application bundle is not serving stale code.
- [ ] The tag is not paused and does not have a production-only exception, schedule, or environment condition.
Use GTM’s built-in variables for web containers when a persistent diagnostic is justified. Container ID, Container Version, Environment Name, and Event can help identify which configuration executed. Do not add these values to ordinary marketing reports permanently without a clear reason; they are most useful in temporary QA logging or a controlled diagnostic endpoint.
Stop here if the live version is wrong. Publishing the correct version is the fix. Changing form selectors, consent settings, or vendor tags before resolving the version mismatch creates a second problem without solving the first.
Gate 2: Does the same action occur in a clean production session?
Run a production test without a Preview connection and without the debug parameter. Google Tag Assistant normally adds _dbg to the page URL and explicitly warns that the parameter can interfere with page behavior. Preview also uses a browser-specific debug context, and the Tag Assistant extension can change how pop-ups, new tabs, and iframe-contained tags are inspected.
A useful comparison uses three sessions rather than one:
| Session | Configuration | What it isolates |
|---|---|---|
| A: clean live control | No Preview, production URL without _dbg, known consent state, ordinary browser profile. | The real visitor path. |
| B: Preview in the same profile | Same URL and cookies, then connect Preview. | Effects caused by the draft container, debug parameter, or debug tooling. |
| C: clean matched-state profile | No Preview, but reproduce the same consent, authentication, region, cart, and experiment state as Session B. | Differences caused by cookies or application state rather than Preview itself. |
Do not use Incognito as the only control. It is useful for testing a first visit, but it may disable extensions, clear consent, change authentication, remove experiment assignments, and create a different checkout session. The goal is not merely “another browser window”; it is a controlled comparison where one variable changes at a time.
Gate 3: Does production generate the same event?
GTM tags fire in response to events. A trigger is evaluated when its event occurs and its conditions are checked at runtime. If Preview shows a tag on gtm.formSubmit, gtm.click, a History Change, timer, or custom event, first prove that the same event exists without Preview.
Preview can create an apparent event advantage in several ways:
- An unpublished click or form trigger in the draft can install a listener that the live container does not have.
- An unpublished trigger with Wait for Tags can delay a link or form transition in Preview, giving a request enough time to leave; ordinary visitors navigate immediately.
- The
_dbgURL parameter can change router logic, cache keys, canonical redirects, server-side conditions, or URL-based trigger rules. - The debug browser can hold different consent, authentication, A/B-test, regional, cart, or session cookies.
- A Custom HTML tag, CMP template, or application script present only in the draft can push an extra
dataLayerevent.
This is why “I see gtm.formSubmit in Preview” is not yet evidence that the production application emitted a successful form event. Compare the application behavior, the dataLayer sequence, and the live Network log.
Gate 4: Was the tag allowed at the exact event time?
Consent must be checked at the moment the tag’s trigger is evaluated. GTM distinguishes built-in consent checks, where a consent-aware tag modifies its behavior, from Additional Consent Checks, where GTM blocks tag execution unless every required consent type is already granted.
For Google tags, Google recommends using their built-in Consent Mode behavior rather than adding unnecessary Additional Consent Checks. If an asynchronously loaded CMP updates consent after a page-load trigger has already occurred, a tag blocked by an Additional Consent Check does not automatically fire merely because consent later becomes granted. It needs a new eligible event. This late-consent architecture is explained in detail in metricfixer’s Consent Mode v2 after page load guide.
Test at least these states separately:
- [ ] first visit before any choice;
- [ ] first visit after rejecting optional storage;
- [ ] first visit after accepting before the conversion action;
- [ ] returning visit with stored granted consent;
- [ ] returning visit with stored denied consent;
- [ ] consent changed immediately before a redirect, form submit, or SPA route change.
In Tag Assistant, inspect the Consent tab for both the default and update sequence. A green tag state is not a substitute for proving that the live CMP sets defaults early, sends updates correctly, and applies the intended Basic or Advanced implementation. For a wider audit of that chain, see metricfixer’s Consent Mode v2 diagnostics guide.
Gate 5: Did a request leave the browser?
This is the decisive browser-side gate. Open DevTools before performing the action, because the Network panel records requests only while it is open. Enable Preserve log so a navigation or redirect does not erase the evidence. Clear the log, perform the action once, and filter by the destination hostname, measurement ID, counter ID, conversion label, or a stable request path.
- Open DevTools and select Network.
- Enable Preserve log.
- Optionally enable Disable cache for a controlled QA run.
- Clear the existing requests.
- Perform the conversion action once.
- Inspect the request’s Headers, Payload, Cookies, Initiator, Timing, and response status.
- Check the Console and Issues panels for CSP, CORS, JavaScript, mixed-content, or extension-related errors.
- Record the timestamp and export a HAR only when it is safe to do so; HAR files can contain URLs, identifiers, cookies, and submitted data.
| Network result | Most likely layer | Next action |
|---|---|---|
| No relevant request exists | Wrong live version, missing event, failed trigger, consent gate, exception, tag sequencing, or runtime error. | Move backward to the first missing event or tag execution step. |
| Request is shown as blocked | Ad blocker, browser privacy rule, CSP, mixed content, firewall, DNS, hosts file, or enterprise proxy. | Inspect the blocked reason, Console, browser privacy panel, and CSP report. |
| Request starts but is canceled around navigation | Page unload, form submit, link click, redirect, closed tab, or SPA teardown. | Fix the event timing or transport; do not treat “tag fired” as delivery. |
| Request completes but has the wrong ID or payload | Incorrect variable, property, counter, event name, value, currency, consent flag, or environment mapping. | Correct the configuration and repeat the production test. |
| Request completes with the expected destination and payload | Browser implementation is working for that session. | Continue to vendor collection, filters, processing, deduplication, and reporting. |
When server-side GTM is used, the browser Network log proves only the first-party request to the tagging server. Continue the trace in the server container debugger: confirm which client claimed the request, which server tags fired, which outbound vendor requests were created, and what responses they received.
Gate 6: Did the platform accept and process the event?
A completed browser request moves the investigation out of GTM and into the receiving system. Check the correct account, property, stream, counter, pixel, conversion action, environment, timezone, and event name. Then inspect platform-specific filters, internal/developer traffic exclusions, deduplication keys, attribution rules, conversion definitions, report latency, and minimum-data requirements.
Examples:
- GA4: compare the request, DebugView, Realtime, Events, Explorations, and key-event settings as separate stages.
- Google Ads: confirm the conversion ID and label, consent signals, conversion action status, and diagnostics rather than expecting the campaign column to update immediately.
- Yandex Metrica: confirm the counter ID and goal call, then check counter filters such as “Don’t count my sessions.” Yandex’s own tag-checking guidance notes that extensions, scripts, firewalls, and even a hosts-file rule for
mc.yandex.rucan block collection. - Meta: separate Pixel Helper, browser Network requests, Test Events, matching, deduplication, custom conversion eligibility, and Ads Manager reporting. Metricfixer’s Meta Pixel and Conversions API event lifecycle maps those stages.
Forms, AJAX, and navigation: why Preview can make a broken implementation look healthy
Native forms and Wait for Tags
GTM’s Form Submission trigger offers two important options. Wait for Tags delays the form’s default submission until dependent tags have fired or the timeout expires. Check Validation limits the trigger to a form GTM considers successfully submitted. Google warns that without Wait for Tags, slow tags may not fire before the next page loads.
This creates a classic Preview-only success:
- A new Form Submission trigger with Wait for Tags exists in the draft.
- Preview loads that draft and installs the form listener.
- The listener temporarily holds navigation, so the analytics request is created and sent.
- The trigger was never published.
- Ordinary visitors use the older live container, the browser navigates immediately, and the request is canceled or never created.
The same pattern applies to a Just Links click trigger with Wait for Tags. The fix is not to keep Preview open. Publish the tested listener when it is appropriate, or redesign the measurement around a reliable application event. Use Wait for Tags selectively on the exact pages and actions that need it; a broad listener can interfere with navigation and create unexpected behavior.
AJAX forms need application-owned success events
Modern forms often call preventDefault(), validate asynchronously, send fetch() or XMLHttpRequest, update the page, and never perform a native form navigation. A GTM Form Submission trigger may therefore be absent, early, or unrelated to the actual server result. A button-click trigger is also weak evidence: it records an attempt before validation, duplicate prevention, CAPTCHA, payment authorization, or backend acceptance.
Google recommends a Custom Event trigger when the form’s default behavior has been altered. The strongest architecture is for the application to push a deterministic event after the backend confirms success. For fetch(), remember that the promise can resolve even when the server returns an HTTP error such as 400, 404, or 500; the application must check response.ok or response.status.
async function submitLead(formData) {
  const response = await fetch('/api/leads', {
    method: 'POST',
    body: formData,
    credentials: 'same-origin'
  });

  if (!response.ok) {
    throw new Error(`Lead submission failed: ${response.status}`);
  }

  const result = await response.json();

  window.dataLayer = window.dataLayer || [];
  window.dataLayer.push({
    event: 'lead_submit_success',
    form_id: 'quote_form',
    lead_reference: result.lead_reference
  });

  return result;
}
Configure GTM to listen for the application event rather than the button:
Trigger type: Custom Event
Event name: lead_submit_success
This trigger fires on: All Custom Events
Use an opaque reference rather than an email address, phone number, name, or other personal data unless the vendor, consent model, contract, and implementation explicitly permit that transfer.
Programmatic submission can bypass the event you are waiting for
Browser behavior also matters. The native submit event fires for a user submit action and for form.requestSubmit(), but not when code calls form.submit() directly. Invalid forms do not produce a successful submit event. A third-party form library, payment widget, or checkout framework can therefore bypass the exact event GTM expects even though the user sees a successful-looking transition.
Instrument the point where the application knows the outcome, not a convenient DOM click that happens earlier. When the form lives in a cross-origin iframe, the parent GTM container cannot inspect its internal DOM or events without cooperation from the iframe provider. That boundary is covered in metricfixer’s third-party iframe conversion tracking guide.
Does the request have enough time to leave before the page changes?
Navigation is a lifecycle boundary. A browser may terminate ordinary asynchronous work when a document unloads, a tab closes, a redirect starts, or a mobile browser moves the page into the background. This is why a request can appear reliable during slow manual debugging but fail for fast production users.
Use these remedies in this order:
- Trigger on confirmed success before navigation. The application should emit the event as soon as it has the business result, not at an arbitrary later page.
- Use the vendor’s supported tag template. Mature analytics tags often use transport strategies designed for page transitions.
- Use Wait for Tags only for genuine native links or forms. It is not a universal AJAX fix and should not delay unrelated navigation.
- For an endpoint you control, consider
navigator.sendBeacon()orfetch()withkeepalive. The Beacon API is intended for small analytics POST requests during page transitions; it does not provide arbitrary methods, headers, or response handling. - For revenue events, use a server-confirmed source of truth. A payment webhook or backend event is more reliable than depending on a thank-you page that a user may never load.
Do not solve navigation loss by adding a fixed delay to every submit button. That degrades the user experience, still fails on slow networks, and can create duplicate submissions. For purchases that leave the site for an external payment provider, use the architecture in metricfixer’s external payment gateway tracking guide.
Are production and debug cookies really equivalent?
The Preview interface itself is browser-scoped, but the larger discrepancy often comes from ordinary site state. The debug browser may already have:
- a stored CMP choice;
- GA, advertising, or vendor identifiers;
- an authenticated session;
- a checkout or cart cookie;
- an A/B-test assignment;
- a locale or region preference;
- a “do not count my visits” filter state;
- a feature flag or staff/admin cookie;
- cached application data or a service worker version.
Compare cookies and storage in DevTools under Application, and compare the Cookies tab on the actual measurement request. Do not copy authentication or customer cookies into tickets or screenshots. Record only the names, relevant state category, scope, and whether the values differ.
Common cookie-driven trigger failures include:
| Condition | Debug browser | Ordinary visitor | Result |
|---|---|---|---|
| Consent cookie | Previously granted | No choice or denied | Tag fires only in the debug profile. |
| Authentication | Logged in as staff or test user | Anonymous | Different DOM, data layer, checkout flow, or API response. |
| Experiment assignment | Variant with native form | Variant with AJAX widget | Only one variant emits the expected event. |
| Cart/session state | Existing test cart | Fresh cart or different checkout domain | Different redirect sequence or thank-you page. |
| Internal-traffic exclusion | Test traffic visible in a debug surface | Production report applies filters | Collection works, but report comparison is misleading. |
CSP, AdBlock, firewalls, and browser privacy
A tag can execute while one of its resources or collection requests is blocked. Content Security Policy is especially important because different directives govern different stages: script-src or script-src-elem can block the library, connect-src can block fetch(), XHR, and beacon requests, img-src can block image pixels, and frame-src can block iframe-based functions.
Google maintains a current CSP guide for Tag Manager, GA4, Google Ads, and Floodlight. It also notes that Preview Mode itself can require additional Tag Assistant and Tag Manager origins. Yandex provides separate CSP requirements for Yandex Metrica, including the relevant script, image, connection, and frame permissions.
When Preview works but production visitors are missing, compare these possibilities:
- The analyst disabled an ad blocker for testing, while ordinary users did not.
- The analyst’s browser privacy mode differs from the traffic mix.
- Production and staging send different CSP headers.
- A checkout subdomain has a stricter CSP than the main site.
- A corporate firewall, DNS filter, proxy, or local hosts file blocks the vendor endpoint.
- The tag library loads, but the collection hostname is blocked under
connect-srcorimg-src. - A service worker or browser extension changes requests only in one profile.
Firefox Enhanced Tracking Protection can block known trackers, cross-site tracking cookies, and—depending on the mode and context—tracking content. Safari/WebKit applies its own tracking-prevention and third-party storage restrictions. These are not necessarily implementation bugs. A defensible measurement plan distinguishes fixable site errors from expected user-side blocking and measures the resulting coverage by browser and consent segment.
For Yandex Metrica, the vendor’s tag-checking documentation and debugger guide recommend checking for AdBlock, other scripts, firewalls, incorrect installation, and a blocked mc.yandex.ru hosts entry. The debugger can be useful, but the browser Network log remains necessary to prove the request path.
Can Preview Mode create an extra event?
Preview Mode does not universally invent a special conversion event. The more precise explanation is that it can load different executable configuration and browser state. That draft may install listeners, timers, History Change handling, Custom HTML, consent templates, or data-layer pushes that do not exist in the published version. The _dbg parameter can also change page logic.
Use this test:
- Identify the exact Preview event on which the tag fired.
- Record its event name and the variables used by the trigger.
- Disconnect Preview and remove
_dbg. - Reproduce the same action with Network and Console open.
- Check whether the application emitted the equivalent event and values.
- If it did not, determine which draft component created or enabled it.
For SPAs, also check whether the event belongs to the initial document or a virtual route. A Preview listener may be initialized before the route change while the production lifecycle is missing initialization, cleanup, or a route-complete event. Metricfixer’s SPA analytics lifecycle guide provides a framework for page views, events, timers, delayed values, and state cleanup.
How the same failure appears across common platforms
| Scenario | Misleading Preview evidence | Production proof to collect | Preferred correction |
|---|---|---|---|
| GA4 lead form | GA4 event tag appears fired on a button click. | Successful form API response, lead_submit_success, and a GA4 collection request with the right event and stream. | Push a custom event after backend success; keep reporting checks separate. |
| AJAX form | gtm.formSubmit appears in the debug browser. | Compare whether the live form performs native submit, calls form.submit(), or uses XHR/fetch. | Instrument the application callback rather than relying on a generic form listener. |
| Yandex Metrica goal | Debugger or console shows a reachGoal call. | Network request to the correct counter endpoint, followed by counter/goal verification and filter review. | Fix blocked requests, counter ID, CSP, goal name, or report filters as indicated. |
| Checkout redirect | Purchase tag fires just before navigation. | Determine whether the request completed and whether the payment itself was confirmed. | Use a payment webhook/backend event with transaction deduplication. |
| SPA route conversion | Tag fires after a manually reproduced route change in Preview. | Verify the same route-complete event, state values, and cleanup on every production navigation path. | Adopt an application-owned virtual page lifecycle. |
| Third-party iframe form | A click on the visible iframe area is treated as conversion intent. | Provider callback, postMessage, API, or webhook proving success. | Use provider cooperation or server confirmation; parent GTM cannot inspect cross-origin internals. |
Fast diagnostic matrix
| Finding | Interpretation | Do next |
|---|---|---|
| Preview shows the tag, but production loads another container version | Deployment mismatch. | Publish or install the correct Live configuration. |
| Same version, but the Preview event does not exist in clean production | Debug-only listener, URL behavior, cookie state, selector, SPA lifecycle, or iframe boundary. | Compare event source and application state. |
| Event exists, but GTM blocks the tag for consent | Consent state or check configuration differs at trigger time. | Fix default/update timing or provide a new eligible post-consent event. |
| Tag fires, no request appears | Template/runtime error, consent-aware suppression, sequencing issue, or request never created. | Inspect tag output, Console, variables, and exceptions. |
| Request is canceled at redirect | Navigation timing loss. | Move to confirmed success, valid Wait for Tags, supported beacon transport, or server event. |
| Request is blocked | CSP, extension, privacy protection, DNS, firewall, proxy, or mixed content. | Use the blocked reason and policy reports; fix only what the site controls. |
| Request completes with wrong destination or values | Configuration error. | Correct IDs, variables, event name, value, currency, or environment mapping. |
| Request is correct, vendor debug surface is empty | Wrong account/property, server-side routing, ingestion rule, filter, or processing issue. | Trace the receiving platform and server container. |
| Vendor debug surface has the event, normal report does not | Processing, report scope, filter, definition, latency, thresholding, or deduplication. | Stop changing GTM and investigate the reporting layer. |
A production release test protocol
A reliable release test should be reproducible by someone who did not build the tag. Use a small matrix instead of one successful Preview session.
- Record the release. Save the GTM version name, publish timestamp, environment, site release, container ID, and changed tags/triggers/variables.
- Define the business assertion. For example: “one accepted lead creates one
lead_submit_successevent with no email or phone data.” - Define the network assertion. Record the expected hostname, property/counter/pixel ID, event name, and required parameters.
- Test clean production. Run without Preview and capture the Network evidence.
- Test consent states. No choice, denied, granted before action, stored granted, stored denied, and withdrawal where relevant.
- Test lifecycle paths. Native navigation, AJAX success/failure, validation failure, duplicate click, back/forward navigation, SPA route change, and external redirect where applicable.
- Test representative browsers. Include at least the browsers and privacy modes that materially affect the site’s audience.
- Test the receiving platform. Confirm collection in the correct property or account, then verify later reporting separately.
- Test duplicates. One business action should not generate multiple client events, server events, or repeated retries without a deduplication key.
- Archive safe evidence. Keep version metadata, timestamps, redacted screenshots, and request summaries without storing credentials or unnecessary personal data.
Production checklist
- [ ] The intended GTM version is published to Live.
- [ ] The production page loads the expected container ID exactly once.
- [ ] The test URL does not contain
_dbgor another debug-only parameter. - [ ] The same application or browser event exists without Preview.
- [ ] Trigger variables have the expected values at that event.
- [ ] Consent defaults and updates occur in the intended order.
- [ ] Built-in and Additional Consent Checks are not being confused.
- [ ] Debug and production sessions use comparable consent, login, experiment, and cart state.
- [ ] Form success is distinguished from click, submit attempt, validation failure, and API failure.
- [ ] DevTools Network is open before the test and
Preserve logis enabled. - [ ] The measurement request exists, is not canceled or blocked, and has the correct destination and payload.
- [ ] CSP, extensions, browser privacy, firewall, DNS, hosts file, and proxy effects have been classified.
- [ ] Server-side GTM outbound requests are traced when applicable.
- [ ] The vendor’s collection/debug surface is checked before standard reporting.
- [ ] Platform filters, conversion definitions, deduplication, attribution, and report latency are reviewed only after browser delivery is proven.
Methodology and sources
This article is based on a review of current Google Tag Manager and Tag Assistant documentation on Preview Mode, publishing, environments, triggers, form and click listeners, custom events, consent checks, and Content Security Policy; Chrome DevTools Network documentation; MDN browser API documentation; Yandex Metrica troubleshooting materials; and browser-vendor privacy documentation. The workflow also incorporates production debugging patterns for GA4, Google Ads, Yandex Metrica, Meta, AJAX forms, SPAs, and checkout redirects. Platform interfaces and endpoints were treated as implementation details; the diagnostic model is organized around durable browser and event-lifecycle stages.
- Google Tag Manager: Preview and debug containers
- Google Tag Manager: Publishing, versions, and approvals
- Google Tag Manager: Environments
- Google Tag Manager: Built-in variables for web containers
- Google Tag Assistant troubleshooting
- Google Tag Manager: About triggers
- Google Tag Manager: Form submission trigger
- Google Tag Manager: Click trigger
- Google Tag Manager: Custom event trigger
- Google Tag Manager consent mode support
- Google Tag Manager: Unblock Google tags when using consent mode
- Google Tag Manager: Troubleshoot consent mode
- Google Tag Platform: Use Tag Manager with a Content Security Policy
- Chrome DevTools Network features reference
- MDN: HTML form submit event
- MDN: Window.fetch()
- MDN: navigator.sendBeacon()
- Yandex Metrica: Checking the tag
- Yandex Metrica tag debugger
- Yandex Metrica: Installing a tag on a site with CSP
- Mozilla: Trackers and scripts Firefox blocks in Enhanced Tracking Protection
- WebKit: Full third-party cookie blocking and tracking-prevention behavior
This article provides technical and operational guidance, not legal advice. Consent requirements, permitted data uses, browser behavior, tag templates, collection endpoints, and platform diagnostics can change. Test with representative consent states and browsers, respect users’ privacy choices, and avoid exposing credentials, cookies, form contents, or personal data in screenshots, HAR files, logs, and support tickets. metricfixer is not affiliated with Google, Yandex, Meta, Mozilla, Apple/WebKit, MDN, or other third-party platforms and publishers mentioned in this article.