
Published Aug 31, 2026
GA4 Users, Active Users, New Users and Sessions: Why Daily Numbers Do Not Add Up
A practical 10-user model showing why GA4 daily user counts overlap, how Active, Total, New and Returning Users differ, which metrics can be added, and where HLL++ changes reconciliation.
Category: Analytics & Conversion Tracking · By Mikalai Sasau
GA4 user metrics are not running counters. A daily point tells you how many qualifying users belonged to that day; the total for a month is recalculated across the whole selected date range and de-duplicates identities that appeared on multiple days. This guide uses ten test users to show why Users, Active users, Total users, New users, Returning users, sessions, engaged sessions, and event users behave differently when you try to add daily values.
Practical rule: never add daily user counts to reproduce a weekly or monthly user total. Treat a user metric as a set of identities for the selected range. Recalculate the union for the full range instead of summing the sizes of daily sets. Sessions and event counts are closer to additive, but GA4 can still estimate some distinct counts with HyperLogLog++.
Executive summary
A common GA4 question looks like this: the whole month shows 1,070 users, while the last day shows 788. Why does the last day not contain the monthly total? Because the last day is not a cumulative month-to-date value. It is the user count for that day. The monthly number is a separate calculation across the entire date range.
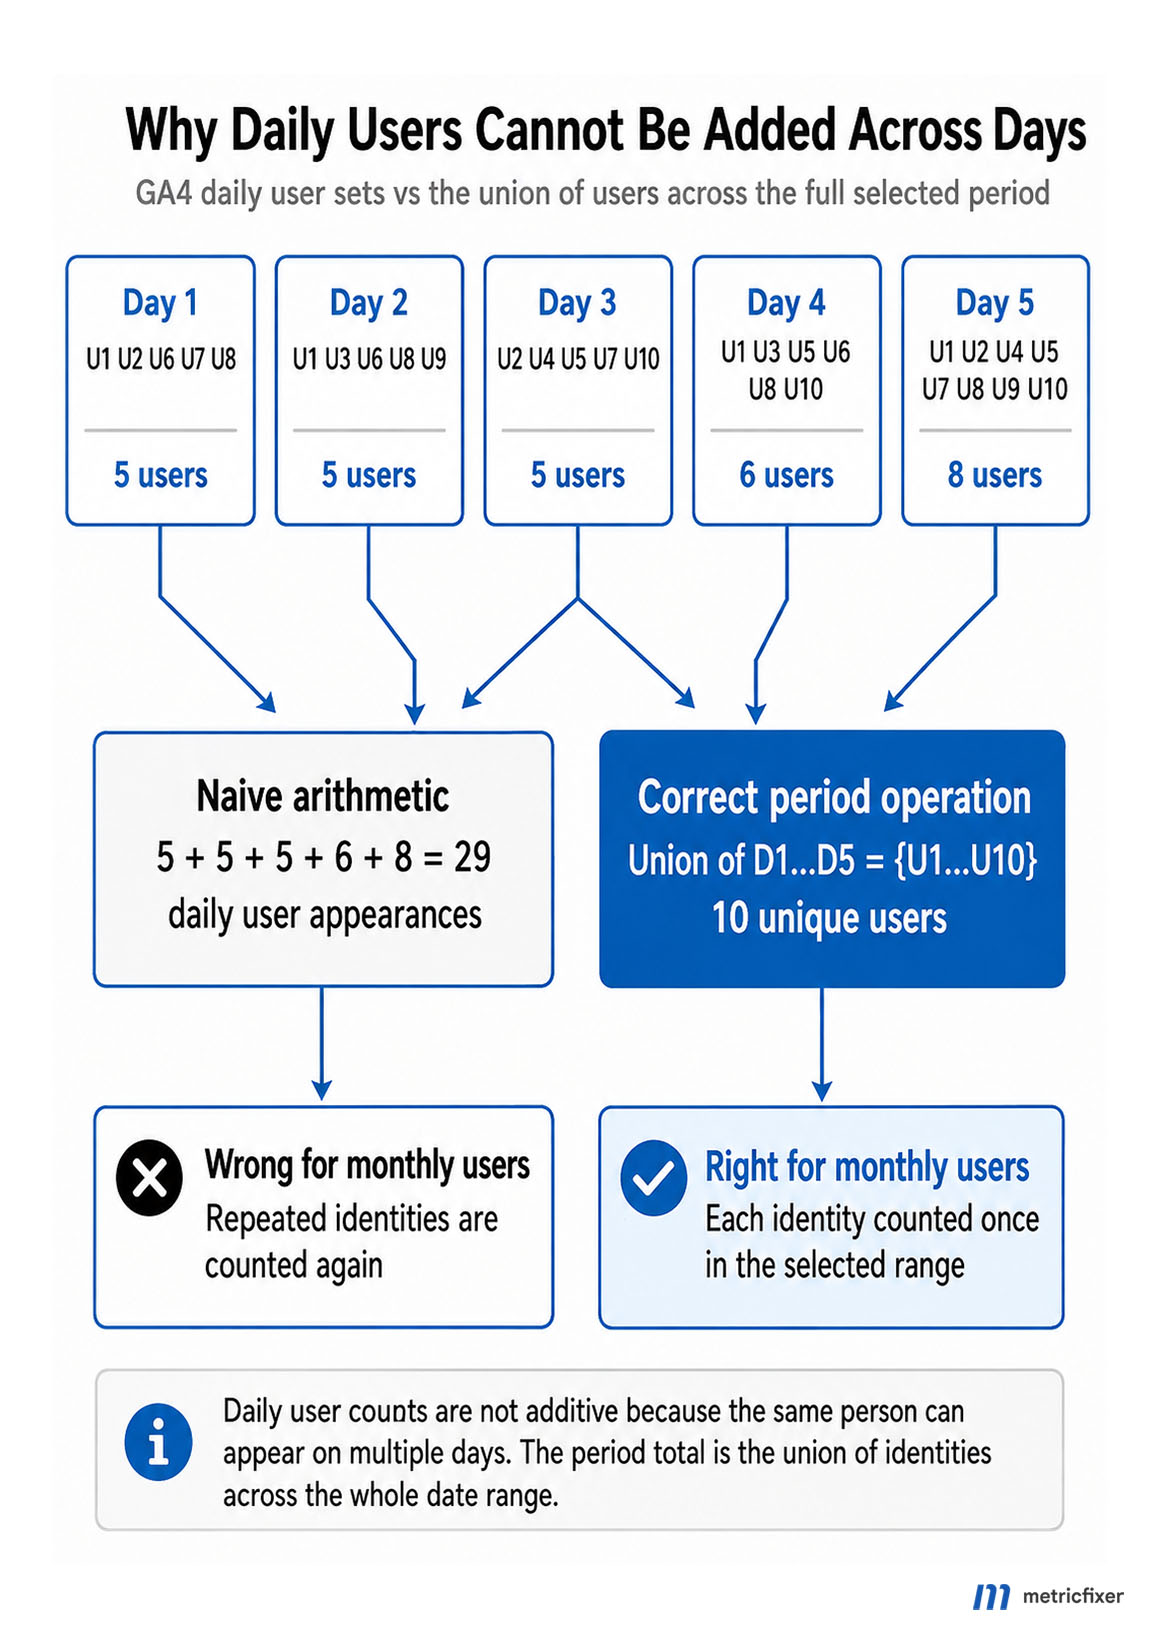
If the same user visits on ten different days, that identity can contribute 1 to each of ten daily points but still contribute only 1 to the monthly unique-user total. In exact set terms, the month is the union of daily user sets, not the arithmetic sum of their sizes.
That distinction applies most strongly to user-based metrics. Google defines Total users as unique users who triggered any event in the selected range, Active users as unique users who met GA4's activity criteria in the selected range, New users as unique users who generated first_visit or first_open, and Returning users as unique users who had at least one previous session. In many standard GA4 reporting surfaces, a label that simply says Users normally refers to Active users, not Total users.
The second complication is that some of these sets overlap. A person can be a New user on Monday and then qualify as a Returning user on Friday. Over a month, the same reporting identity can therefore belong to both groups. This is why New users + Returning users is not a valid formula for Total users.
The third complication is computational. Google documents that GA4 uses HyperLogLog++ (HLL++) to estimate cardinality for frequently used distinct-count metrics, including Active users, Total users, and Sessions. This is not the same as sampling. Even an unsampled report can use an approximate distinct-count sketch. Google says discrepancies are usually small, commonly below 1%, but the important point is that the large gap between a sum of daily users and a period user total is normally caused by overlap, not by HLL++.
The easiest way to understand all of this is to stop thinking in rows and start thinking in identities.
The 1,070 vs 788 question in one sentence
Suppose the selected month contains 1,070 unique Active users and the final day contains 788 Active users. The 788 users are a subset of the users who were active somewhere in the month. The remaining users were active on earlier days but not on the final day. In an exact, stable dataset with identical filters and identity rules, that means roughly 282 monthly users were not active on the last day.
What the final-day number does not mean is “788 of the 1,070 have been accumulated so far.” A normal daily time-series point is not a running month-to-date distinct count. If you want a rolling window, use a metric designed for that purpose, such as 7-day or 28-day active users, rather than interpreting the last daily point as a monthly subtotal.
A controlled example with ten users
Consider a five-day reporting period with ten GA4 reporting identities: U1 through U10. U1–U5 are first seen during the selected period. U6–U10 already had at least one session before Day 1. Some users visit once, some return several times, some create multiple sessions in one day, some have short non-engaged sessions, and some trigger the purchase event more than once.
The table deliberately separates user status from session engagement. A first-time web visitor can qualify as an Active user because GA4 collected first_visit even when that specific session does not meet the engaged-session rule. Conversely, a known returning user can trigger an event in a short visit and count toward Total users and Returning users without qualifying as Active on that day.
| User | Before Day 1 | Day 1 | Day 2 | Day 3 | Day 4 | Day 5 |
|---|---|---|---|---|---|---|
| U1 | No prior session | New · active · engaged · 1 session · 1 purchase | Returning · active · engaged · 1 session | — | Returning · active · engaged · 1 session · 1 purchase | Returning · active · engaged · 1 session |
| U2 | No prior session | New · active via first_visit · 1 non-engaged session | — | Returning · active · engaged · 1 session | — | Returning · active · 2 sessions · 1 engaged · 1 purchase |
| U3 | No prior session | — | New · active · engaged · 1 session · 1 purchase | — | Returning · active · engaged · 1 session | — |
| U4 | No prior session | — | — | New · active via first_visit · 1 non-engaged session | — | Returning · active · engaged · 1 session |
| U5 | No prior session | — | — | New · active · engaged · 1 session · 1 purchase | Returning · 1 non-engaged session | Returning · active · engaged · 1 session |
| U6 | Prior session exists | Returning · active · engaged · 1 session | Returning · active · engaged · 1 session · 1 purchase | — | Returning · active · engaged · 1 session | — |
| U7 | Prior session exists | Returning · active · 2 sessions · 1 engaged · 1 purchase | — | Returning · active · engaged · 1 session | — | Returning · 1 non-engaged session |
| U8 | Prior session exists | Returning · 1 non-engaged session | Returning · 1 non-engaged session | — | Returning · active · engaged · 1 session | Returning · active · engaged · 1 session |
| U9 | Prior session exists | — | Returning · active · engaged · 1 session | — | — | Returning · active · engaged · 1 session |
| U10 | Prior session exists | — | — | Returning · active · 2 sessions · 1 engaged · 1 purchase | Returning · active · engaged · 1 session | Returning · active · 2 engaged sessions · 2 purchases |
What GA4-style counting produces from the same ten users
Now calculate the metrics separately for each day, and then calculate them again for the complete five-day range.
| Range | Total users | Active users | New users | Returning users | Sessions | Engaged sessions | Purchase users | Purchase events |
|---|---|---|---|---|---|---|---|---|
| Day 1 | 5 | 4 | 2 | 3 | 6 | 3 | 2 | 2 |
| Day 2 | 5 | 4 | 1 | 4 | 5 | 4 | 2 | 2 |
| Day 3 | 5 | 5 | 2 | 3 | 6 | 4 | 2 | 2 |
| Day 4 | 6 | 5 | 0 | 6 | 6 | 5 | 1 | 1 |
| Day 5 | 8 | 7 | 0 | 8 | 10 | 8 | 2 | 3 |
| Naive sum of daily rows | 29 | 25 | 5 | 24 | 33 | 24 | 9 | 10 |
| Recalculated for Days 1–5 | 10 | 10 | 5 | 10 | 33* | 24 | 7 | 10 |
*Conceptually there are 33 sessions because each test session starts once. GA4's reported Sessions metric is itself a distinct-count estimate based on session identifiers, so a production UI total can differ slightly from an exact raw-data reconstruction.
This one table explains most apparent contradictions:
- Total users: 29 daily user appearances collapse to 10 unique identities across the range.
- Active users: 25 daily active-user appearances collapse to 10 identities because the same people were active on multiple days.
- New users: the daily values happen to sum to the period value of 5 because each identity can generate its first visit only once in this controlled model.
- Returning users: daily rows sum to 24, but all ten users qualify at least once as returning somewhere in the full period, so the period count is 10.
- Purchase users: the daily rows sum to 9, but only seven distinct identities purchased during the five days.
- Purchase events: the event count is 10 both ways because these are ten recorded occurrences, not seven unique people.
Total users: a distinct set, not a counter
Google defines Total users as the number of unique users who triggered any event in the selected date range. In the ten-user model, the daily Total-user sets are:
- Day 1: U1, U2, U6, U7, U8
- Day 2: U1, U3, U6, U8, U9
- Day 3: U2, U4, U5, U7, U10
- Day 4: U1, U3, U5, U6, U8, U10
- Day 5: U1, U2, U4, U5, U7, U8, U9, U10
The arithmetic sum of set sizes is 29. The union is:
{U1, U2, U3, U4, U5, U6, U7, U8, U9, U10}
That union contains ten identities. The period total is therefore 10, not 29.
The same logic applies if you break users down by country, device, campaign, page, event name, or another dimension that a user can occupy more than once. If one person appears in several rows, adding the row-level user counts double-counts that person. A report total is normally recalculated from the union of qualifying users, not from the visible row values.
Active users and the misleadingly simple label “Users”
GA4 focuses many standard reports on Active users rather than every user who generated any event. Google defines an Active user as a unique user who had an engaged session or for whom Analytics collected specific activity signals such as first_visit or engagement_time_msec on the web. Google's own BigQuery reconciliation guidance says that when the UI simply says Users, it usually refers to Active users.
This matters because Total users and Active users can legitimately differ. In the model, U8 is a Returning user on Day 1 and Day 2 but has only a short, non-engaged session on each day. U8 therefore contributes to Total users and Returning users on those days, but not to Active users. U8 later becomes active on Day 4 and Day 5.
By contrast, U2 on Day 1 and U4 on Day 3 have non-engaged first sessions but still qualify as active through the first-visit activity condition. That is why the user and session metrics should not be treated as different labels for the same concept.
For acquisition and funnel analysis, this distinction is also why comparing a user-based funnel directly with raw sessions or event counts can produce different but valid results. For a broader treatment of counting units, see metricfixer's GA4 funnels guide comparing users, sessions, events, Exploration, and BigQuery.
New users: special, but not a universal exception
New users are based on the first-time events first_visit for websites and first_open for apps. The important phrase is first time for that reporting identity, not “first time inside the date range.” A person whose identity visited before the selected month and returns during the month is a Returning user, not a New user merely because this is their first appearance in the current report window.
Because a stable GA4 identity should only generate its first-time event once, New users are much closer to an additive daily metric than Active users or Total users. In the controlled model, Day 1 has U1 and U2, Day 2 has U3, and Day 3 has U4 and U5. The daily values 2 + 1 + 2 equal the five New users in the complete range.
But this should not be generalized into “all user metrics can be summed if they look stable.” A cookie reset, a new browser, a different app instance, missing User-ID continuity, consent changes, or a different reporting identity can cause the same real person to be represented by more than one Analytics identity. New users are therefore a property of GA4's identity system, not a count of biologically unique human beings.
Returning users: why the set can overlap New users
Returning users are unique users who have initiated at least one previous session. This creates one of the most important GA4 set-overlap cases.
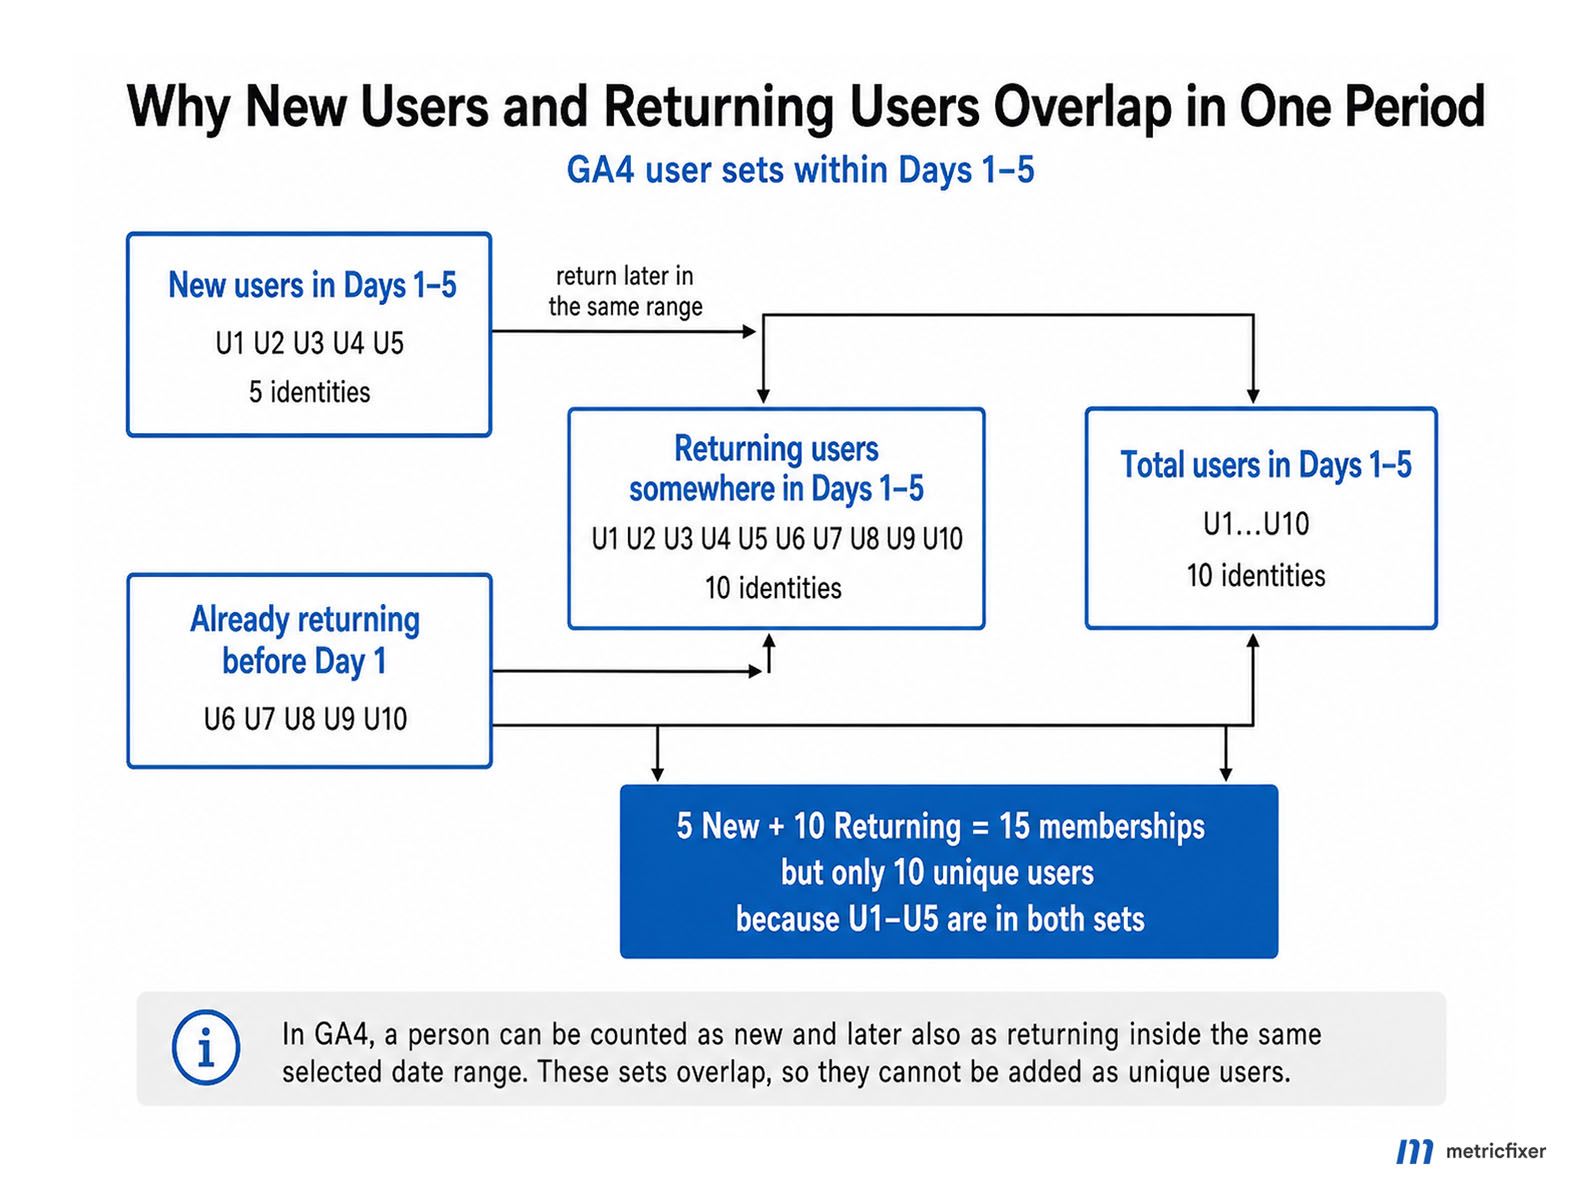
U1 is new on Day 1. When U1 comes back on Day 2, the same identity is now returning. Over Days 1–5, U1 belongs to both the New-user set and the Returning-user set. The same happens to U2, U3, U4, and U5 because each of them returns later inside the selected period.
For the complete five-day range:
- New users = {U1, U2, U3, U4, U5} = 5
- Returning users = {U1, U2, U3, U4, U5, U6, U7, U8, U9, U10} = 10
- Total users = {U1, U2, U3, U4, U5, U6, U7, U8, U9, U10} = 10
So New users + Returning users = 15 while Total users = 10. Nothing is missing. Five identities are present in both categories.
In set notation, the correct relationship is:
|New ∪ Returning| = |New| + |Returning| − |New ∩ Returning|
In this example, 5 + 10 − 5 = 10.
Sessions and engaged sessions: a different counting unit
A GA4 session is a group of interactions that begins when a user opens the app in the foreground or views a page/screen while no session is active. Google automatically creates a session_start event and associates events with a ga_session_id. On web, the default inactivity timeout is 30 minutes, although it can be changed.
An engaged session is a session that lasts longer than the configured engagement threshold, has a key event, or has at least two page or screen views. The common default threshold is 10 seconds, but GA4 allows the web-stream setting to be adjusted.
Sessions behave differently from users because one user can create many sessions. U7 creates two sessions on Day 1. U2 creates two on Day 5. U10 creates two on Day 3 and two on Day 5. The five-day model therefore contains 33 sessions but only ten users.
Conceptually, session starts are much more naturally additive across non-overlapping dates: each session begins once. If you define a raw session key as the combination of user_pseudo_id and ga_session_id, those session identities can be counted across the entire range. However, Google documents that the GA4 Sessions metric is estimated from unique session identifiers with HLL++. This means the displayed period total and the arithmetic sum of separately estimated daily session totals can differ slightly even when the underlying business logic is additive.
Engaged sessions are a subset of sessions, not users. In the model, the same user can create both an engaged and a non-engaged session on the same day. That is why “7 Active users” and “8 Engaged sessions” on Day 5 is entirely possible.
Event users: another distinct-count trap
The Events report makes the same set logic visible from a different angle. Google defines Event count as the number of times users triggered an event and Total users in the Events report as the number of unique users who triggered at least one event. When you look at one event-name row, such as purchase, the user value answers “how many distinct users triggered this event?”
In the ten-user model, the purchase-user sets are:
- Day 1: U1, U7
- Day 2: U3, U6
- Day 3: U5, U10
- Day 4: U1
- Day 5: U2, U10
The daily purchase-user values sum to 9, but the period has only seven distinct purchasing identities: U1, U2, U3, U5, U6, U7, and U10.
Meanwhile the period has ten recorded purchase event occurrences because U1 purchases on two different days and U10 purchases once on Day 3 and twice on Day 5. The event count adds cleanly in this synthetic example because an event occurrence is an occurrence; the user count does not because a user is a de-duplicated identity.
The same warning applies across event-name rows. If U1 triggers page_view, scroll, add_to_cart, and purchase, U1 may be counted once in the Total users value for each event row. Summing those row-level users would count one person four times.
Which GA4 metrics can you add?
| Metric type | Examples | Can daily values be added? | Why |
|---|---|---|---|
| Distinct user metrics | Total users, Active users, Returning users, purchasers, users of a specific event | No | The same identity can appear on multiple days or in multiple dimension rows. Recalculate the union for the full range. |
| New-user metric | New users | Usually closer to yes across non-overlapping dates | A stable identity should generate first_visit/first_open once, but identity resets, reporting identity, thresholding, and processing can complicate reconciliation. |
| Session metrics | Sessions, Engaged sessions | Conceptually much closer to yes | Each session starts once, but GA4 estimates Sessions with HLL++, and session/engagement processing can differ from an exact raw-data reconstruction. |
| Occurrence metrics | Event count, Views | Generally yes | Each recorded occurrence belongs to a date. Still validate late processing, filters, and whether the definition itself changed. |
| Rates and averages | Engagement rate, Sessions per user, Average engagement time | No | A percentage or average must be recomputed from its numerator and denominator for the target range; averaging daily percentages gives incorrect weighting. |
The operational rule is simple: before you sum a GA4 column, identify its counting unit. If the unit is a unique user, purchaser, or other distinct identity, assume it is non-additive unless you can prove otherwise. If the unit is an event occurrence, it is usually additive across disjoint dates. If the unit is a ratio, recompute it.
HyperLogLog++: why GA4 can be unsampled and still approximate
Distinct counting becomes expensive at scale. To calculate an exact monthly user total, a system would need to keep enough information to determine whether every identity has already been seen somewhere else in the range. Google uses HyperLogLog++ sketches to estimate cardinality more efficiently.
Google's published GA4 configuration uses HLL++ precision 14 for Active users and Total users and precision 12 for Sessions. Google also states that unsampled reports still use HLL++ for commonly used distinct counts, with discrepancies usually below 1% in most cases.
This creates two separate reasons why “sum of days” is not the right reconciliation:
- Set overlap: the same user appears on several days. This can create a very large difference, such as 29 daily user appearances versus ten period users in the example.
- Approximation: each displayed distinct count can be an HLL++ estimate. Even if the underlying units were logically additive, separately estimated daily values do not have to sum exactly to a separately estimated period value.
The first reason is the fundamental one. HLL++ should not be used as a convenient explanation for a 20%, 50%, or 200% user mismatch when repeated visitors clearly overlap across days.
HLL++ is also different from sampling. Sampling analyzes a subset of event data when a query exceeds a processing limit. HLL++ can process the relevant dataset while storing a compact sketch of distinct identities instead of an exact list. Thresholding is different again: it can withhold rows or values to protect privacy. These mechanisms can all affect what you see, but they are not interchangeable explanations.
Why HLL sketches can be merged but displayed counts should not be summed
Google Cloud documents that HLL++ sketches can be merged to estimate the union of their underlying sets. That is exactly the mathematical operation required for a period-level unique-user count. The wrong operation is to extract a number from each daily sketch and then add those numbers.
Conceptually:
- Correct: merge Day 1 set + Day 2 set + Day 3 set + Day 4 set + Day 5 set, then count the union.
- Wrong: count Day 1 + count Day 2 + count Day 3 + count Day 4 + count Day 5.
This is why the period total is not an “Excel SUM” of the chart points.
BigQuery: exact distinct count versus the tempting daily sum
BigQuery is useful when you need to make the counting rule explicit. For a device-based reconstruction, an exact Total-user count over a selected range can start with COUNT(DISTINCT user_pseudo_id). This is not guaranteed to equal a Blended or Observed GA4 UI because the UI can use User-ID, device identity, modeling, thresholds, and different processing rules, but it clearly demonstrates the aggregation principle.
Correct period-level distinct count:
SELECT
  COUNT(DISTINCT user_pseudo_id) AS exact_period_users
FROM `project.analytics_123456789.events_*`
WHERE _TABLE_SUFFIX BETWEEN '20260401' AND '20260430';
Tempting but wrong way to reproduce period users:
WITH daily AS (
  SELECT
    event_date,
    COUNT(DISTINCT user_pseudo_id) AS daily_users
  FROM `project.analytics_123456789.events_*`
  WHERE _TABLE_SUFFIX BETWEEN '20260401' AND '20260430'
  GROUP BY event_date
)
SELECT
  SUM(daily_users) AS wrong_monthly_user_total
FROM daily;
The second query does not calculate monthly unique users. It calculates daily user appearances. A user who visited on 12 days contributes 12 to that sum.
If you intentionally work with HLL++ sketches, merge the sketches before extracting the final cardinality:
WITH daily_sketches AS (
  SELECT
    event_date,
    HLL_COUNT.INIT(user_pseudo_id, 14) AS users_hll
  FROM `project.analytics_123456789.events_*`
  WHERE _TABLE_SUFFIX BETWEEN '20260401' AND '20260430'
  GROUP BY event_date
)
SELECT
  HLL_COUNT.MERGE(users_hll) AS approximate_period_users
FROM daily_sketches;
This demonstrates the correct union logic, but do not expect it to reproduce every GA4 UI user number exactly. Google's documentation notes a sparse-precision difference between GA4's user sketches and BigQuery's HLL++ implementation, and BigQuery exports do not reproduce all modeled identities from Analytics reporting.
“Unique user” means unique according to the reporting identity
The phrase “unique user” sounds absolute, but in analytics it is conditional. GA4 can identify activity using User-ID, device identifiers, and modeling depending on the property's reporting identity.
This creates two opposite effects:
- One person can become several GA4 users. The same person can use a phone and laptop, delete cookies, reset an app instance, browse without a persistent identifier, or move between consent states that prevent continuity.
- Several device identities can be unified into one reported user. A consistently implemented User-ID, and in some configurations modeling, can reduce cross-device duplication in reports.
Therefore, a monthly user total is not “the exact number of human beings who know our brand.” It is the distinct count produced by GA4's available identity spaces and reporting rules for the selected range.
This is also why BigQuery and the GA4 UI can disagree even when both are technically correct. Raw BigQuery event export exposes identifiers such as user_pseudo_id and any collected user_id, but it does not simply reproduce every modeled user journey shown in a blended reporting surface.
Daily cohorts overlap even when each daily row is correct
It is useful to think of each day as a cohort defined by the condition “was this identity counted today?” These daily cohorts are not mutually exclusive. U1 belongs to the Day 1, Day 2, Day 4, and Day 5 Total-user sets. U8 belongs to four daily Total-user sets but only two daily Active-user sets.
This gives analysts an important diagnostic signal: the gap between the sum of daily user appearances and the range-level distinct user total is partly a measure of repeat presence. It is not a formal retention metric, but a large gap is expected when many users return on multiple days.
For example, the ten-user model has 29 daily Total-user appearances and ten range-level Total users. The ratio 29 / 10 = 2.9 means the average reporting identity appeared on 2.9 of the five days. That can be a useful descriptive calculation, but it should not be mislabeled as sessions per user, active days per human, or retention rate.
Why report totals may not equal the sum of visible dimension rows
The same non-additivity appears beyond dates. Suppose one user visits from both mobile and desktop, or is attributed to different session channels on different visits. A user-based metric can count that identity in more than one dimension row. The grand total can still count it once for the whole range.
This is why the following reconciliations are unsafe:
- summing Active users by date to reproduce monthly Active users;
- summing users by country when users can travel or be geolocated differently across visits;
- summing users by device category when one person uses multiple devices;
- summing users by session channel across a period when a user has sessions from several channels;
- summing users across event-name rows in the Events report;
- summing New users and Returning users as if the groups were mutually exclusive.
If you need a metric that is truly row-additive, choose a unit that belongs to one row by definition, such as a specific event occurrence or a transaction with a controlled unique ID. For advertising reconciliation, metricfixer's Google Ads clicks vs GA4 users, sessions, and page views guide applies the same principle: clicks, sessions, users, views, and key events are different units and should not be forced into one total.
Do not blame every mismatch on sampling
When a GA4 total does not match a spreadsheet sum, analysts often reach for “sampling” as the explanation. That is frequently wrong.
| Mechanism | What it does | Can it affect reconciliation? | Typical diagnostic |
|---|---|---|---|
| Set overlap | The same identity belongs to several days or dimension rows. | Yes, often dramatically. | Recompute the union at the target range instead of summing row-level users. |
| HLL++ | Estimates distinct cardinality with a compact sketch. | Yes, usually slightly. | Compare with exact COUNT(DISTINCT) in a compatible BigQuery identity model. |
| Sampling | Runs the analysis on a subset when query limits are exceeded. | Yes. | Check the data-quality indicator and Exploration sampling information. |
| Thresholding | Withholds data to reduce the risk of identifying individuals. | Yes. | Check the data-quality indicator for thresholding. |
| Reporting identity/modeling | Changes how activities are unified into reported users. | Yes. | Document whether the property uses Blended, Observed, or Device-based identity and whether modeled data is involved. |
Google's data-threshold documentation is especially relevant when demographics, audiences, or low-volume data are involved. Thresholding can hide rows and make a visible table even less suitable for manual summation.
Seven common mistakes when reading daily GA4 user charts
- Treating the last point as a cumulative total. A normal daily point is the count for that day, not the amount accumulated since the start of the chart.
- Adding user rows in Excel. This produces user appearances across rows, not unique users across the range.
- Assuming “Users” always means Total users. In many GA4 reports it usually means Active users.
- Assuming New and Returning are mutually exclusive. The same identity can be new early in the period and returning later.
- Using event users as an event count. Seven users can generate ten purchase events; the two metrics answer different questions.
- Calling every difference sampling. HLL++, thresholding, identity, and ordinary set overlap are separate mechanisms.
- Expecting BigQuery raw identity to equal the UI by default. Exact
COUNT(DISTINCT user_pseudo_id)answers a device-identity question unless you deliberately reproduce the reporting identity and active-user logic.
A practical reconciliation workflow
When a stakeholder says “the monthly users do not equal the daily total,” use the following order.
- Identify the exact metric. Is the UI showing Active users, Total users, New users, Returning users, Sessions, Engaged sessions, purchasers, or users of a particular event?
- Identify the counting unit. Is one unit a user identity, a session, an event occurrence, or a transaction?
- Check whether the rows can overlap. Can the same identity appear on multiple dates, devices, channels, countries, events, or audience rows? If yes, do not sum user counts.
- Recalculate for the requested date range. Ask for the distinct union over the whole period rather than a sum of daily distinct counts.
- Check reporting identity. Document User-ID, device identity, modeling, and any consent conditions that change continuity.
- Check data-quality indicators. Look for sampling and thresholding before interpreting smaller discrepancies.
- Allow for HLL++. Small differences in users and Sessions can remain because GA4 estimates distinct cardinality.
- Use BigQuery for an explicit definition. Count exact raw identities when that is the business question, or reproduce HLL++ when you need a closer UI-style approximation.
- Do not force equality between different surfaces. A UI metric, an Exploration, a Data API result, and a raw BigQuery query can use different identity, modeling, sampling, and estimation behavior.
What should a dashboard show instead?
If decision-makers repeatedly misread a daily user chart, the dashboard should make the aggregation rule explicit. A useful pattern is:
- Period Active users: distinct users for the complete selected range.
- Daily Active users: a trend line labeled “daily unique active users,” not “users accumulated.”
- New users: first-time identities in the range.
- Returning users: identities that had previous sessions, with a note that New and Returning can overlap within the period.
- Sessions: visits/session starts, kept separate from users.
- Engaged sessions: session-quality metric, not an alternative user total.
- Event users and Event count: both shown when the business needs to know how many people performed an action and how many times the action happened.
For recurring executive reporting, it can also be useful to include active days per period user or sessions per active user as explicitly calculated engagement measures. These are easier to interpret than a spreadsheet sum of daily user points.
The bottom line
A GA4 user total belongs to the selected date range. Change the range and GA4 changes the set that is being de-duplicated. A daily chart therefore contains a series of daily distinct counts, while the headline month value is a distinct count across the whole month. The last day is not supposed to contain the monthly total.
Remember the four rules:
- Users are sets. Add identities by union, not by arithmetic.
- New and Returning can overlap. A new user can return later in the same reporting period.
- Sessions and events are different units. One user can create many sessions and many events.
- HLL++ is a second-order effect. It explains small distinct-count differences; it does not explain the basic non-additivity of repeated users.
Once those rules are explicit, a report where the month shows 1,070 users and the last day shows 788 stops looking contradictory. It is simply showing two different set sizes for two different date ranges.
Methodology and sources
This article was researched against current Google Analytics and Google Cloud documentation available on 30 August 2026. The review covered GA4 user metric definitions, reporting identity, session and engaged-session definitions, Events report metrics, Data API metric definitions, sampling and thresholding behavior, GA4's HyperLogLog++ implementation, BigQuery reconciliation guidance, and BigQuery HLL++ sketch merging. The ten-user example is a controlled synthetic dataset built to isolate aggregation behavior; it is not presented as a benchmark for normal retention, engagement, or conversion rates.
- Google Analytics: Understand user metrics
- Google Analytics: About Analytics sessions
- Google Analytics: Session and engaged session
- Google Analytics: Events report
- Google Analytics: Reporting identity
- Google Analytics: About data sampling
- Google Analytics: About data thresholds
- Google Analytics Data API dimensions and metrics
- Google for Developers: Unique count approximation in Google Analytics
- Google for Developers: Bridge the gap between the Analytics UI and BigQuery export
- Google for Developers: Basic queries for Google Analytics event export
- Google Cloud: HyperLogLog++ functions
- Google Cloud: Sketches and mergeable approximate aggregates
This article is for technical and analytical information only. Google Analytics reporting identity, modeling, data thresholds, sampling limits, engagement settings, BigQuery schemas, metric definitions, and product interfaces may change after publication. The synthetic user example intentionally simplifies identity and event processing so the aggregation logic is visible. For financial, contractual, or operational reconciliation, validate the current GA4 configuration against raw collection requests, BigQuery export, backend transaction data, and the exact report surface being used. metricfixer is not affiliated with Google.